
What is a triangle chart pattern and how does it work? Figure out the types of triangle chart patterns and how to trade them with profit on FX2 Blog.
Chart patterns are an integral part of technical analysis as they provide valuable insight into market sentiment, and the direction the price is likely to move based on what happened in the past. While there is no “best” chart pattern as all are used to highlight different trends, some stand out in their ability to provide reliable trading signals.
The trading patterns are broadly classified into bearish and bullish. However, some patterns stand out when trading volatile markets, while others work well in range-bound markets. Therefore, knowing the “best” chart pattern to use to trade a particular market is essential.
Below are some of the most popular forex chart patterns.
A triangle pattern is one of the most popular chart patterns in forex. The trading pattern occurs when prices converge with highs and lows, narrowing into a tighter price area. They are broadly classified into ascending and descending triangle patterns.
The ascending triangle pattern is a continuation of chart patterns in forex trading that occurs when currency pairs are trending up. It occurs when price action creates a horizontal resistance line and an ascending support line at the top of an uptrend. It also happens as weakness kicks in, following a solid move to the upside.
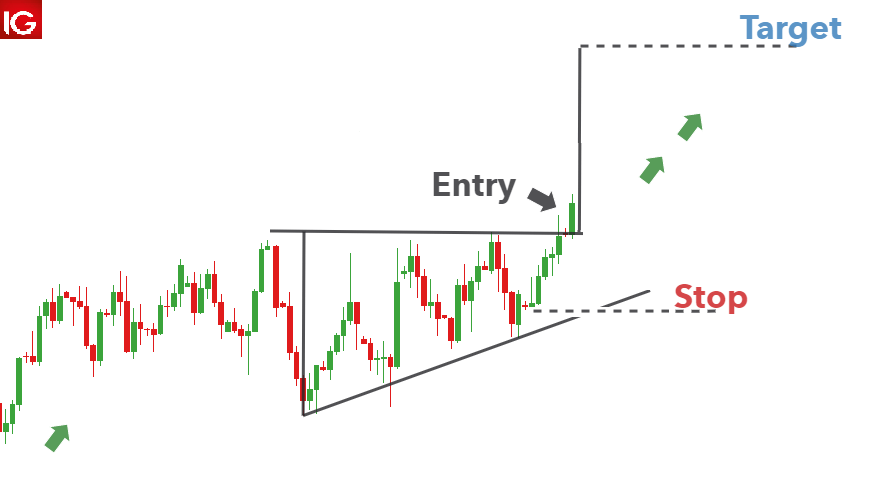
Source: Dailyfx.com
In most cases, the price breaks out of the ascending triangle pattern and moves up to continue the previous underlying trend.
The descending triangle pattern is also a continuation pattern that appears when the market is trending downwards. It is synonymous with a horizontal support line and a descending resistance level.
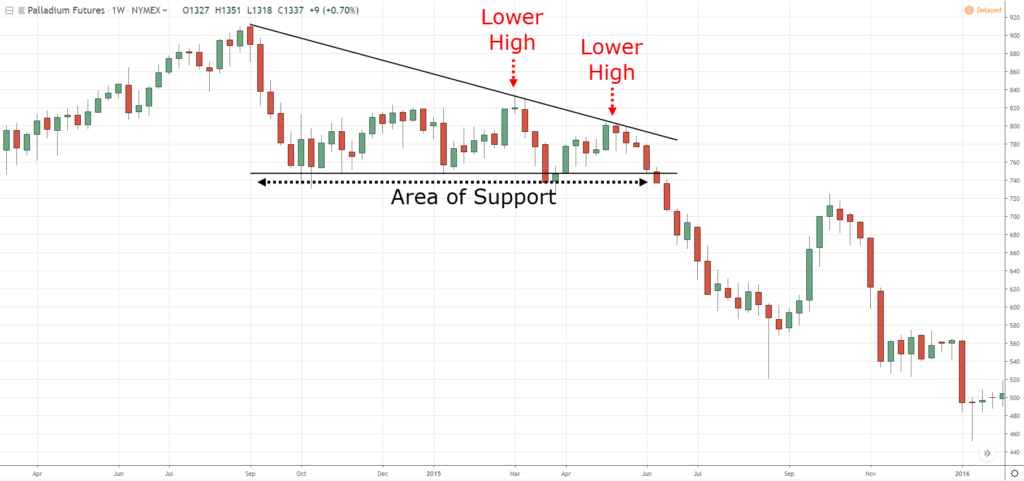
Source: Tradingwithrayner.com
Once prices become tighter and tighter within the triangle, they end up breaking out to the downside. Consequently, the occurrence of a descending triangle pattern signals the likelihood of price edging lower after some time in continuation of the underlying downtrend.
Engulfing price patterns are common chart patterns in forex trading that are easy to spot and signal a potential change in the direction of the underlying trend. There are two types of engulfing patterns: Bullish Engulfing and Bearish.
It occurs when the price appears to be moving lower. The pattern consists of one large bullish candlestick that engulfs the previous bearish candlestick. When the large bullish candle occurs when a currency pair is trending lower, it affirms a change in market sentiments from bearish to bullish.
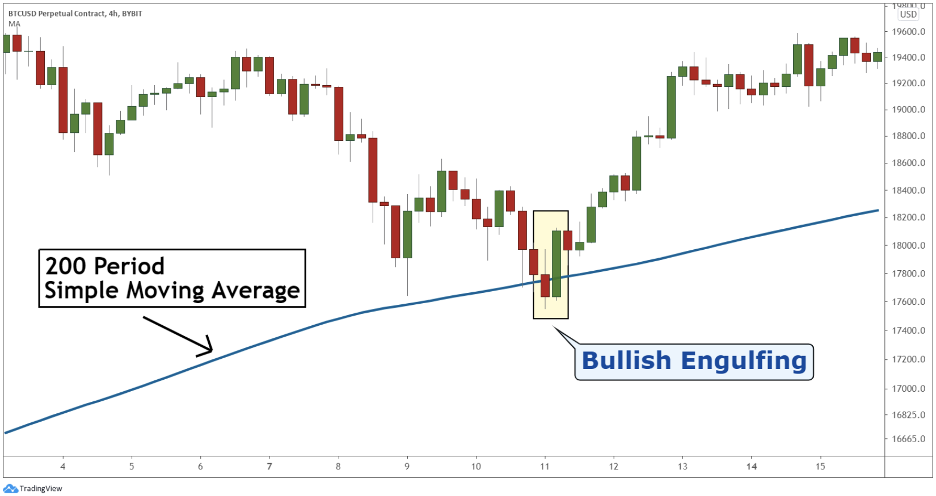
Source: Bybit.com
The bullish engulfing candlestick signals a buildup in buying pressure, implying prices are likely to continue moving up on reversing course from a downtrend.
It typically occurs at the top of an uptrend. It is characterized by a large bearish candle that engulfs the previous bullish candlestick. The large bearish candlestick implies a change in market sentiments from bullish to bearish on bears overpowering bulls.
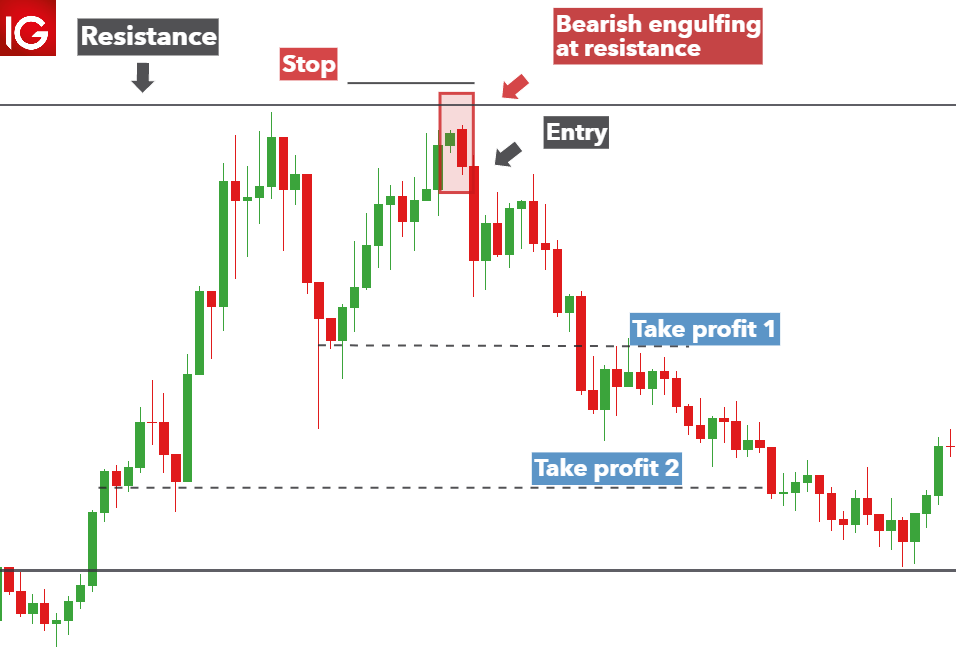
Source: Dailyfx.com
Consequently, the price often reverses course, from trending up to edging lower as bears enter the market and pile pressure on bulls.
Head and Shoulder is a typical chart pattern that occurs in range-bound or trending markets. The chart pattern is characterized by a large price peak in the middle with two smaller peaks on either side. The two peaks on either side will be at the same level and slightly below the higher, larger peak. It acts as a reversal pattern implying a change in sentiments from bullish to bearish.
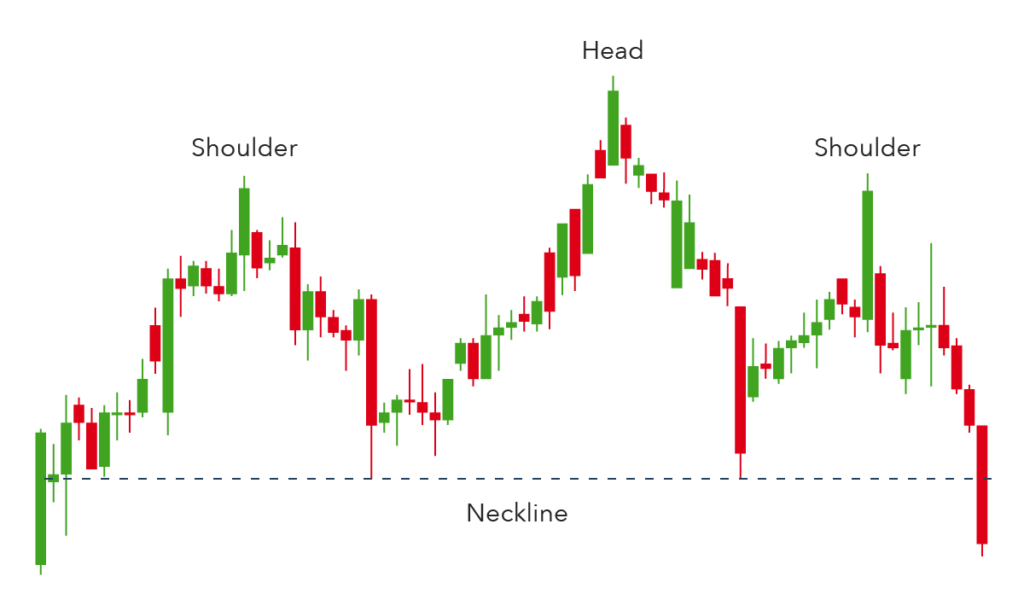
Source: IG.com
Once the third smaller peak on the side breaks below the previous level, it affirms a bearish breakout with prices expected to edge lower as part of a new downtrend. Consequently, traders use this chart pattern to enter short positions.
Another trend reversal pattern that occurs at the top of an uptrend is the Double Top. The pattern occurs when the price tries to break out of a resistance level only to experience a strong sell-off resulting in lower prices. However, buyers continue to enter the market at the neckline and try to push the price higher. Nevertheless, they experience strong opposition at the top resistance level, resulting in the price edging lower.
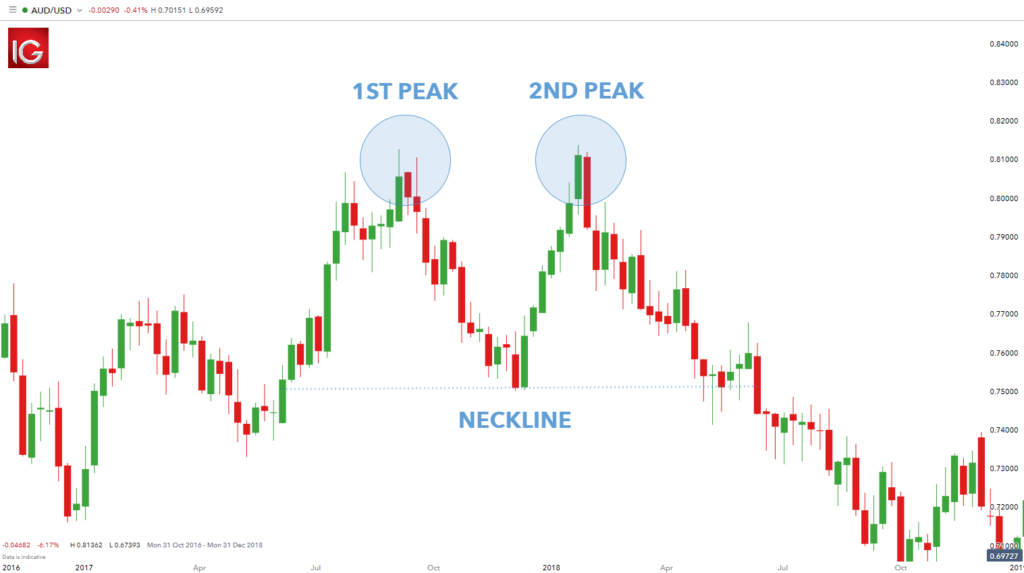
Source: Dailyfx.com
The fact that the price tried and failed to move higher on two tries results in two tops, thus the double top pattern. Technical analysts enter short trades as price breaks below the neckline or support level after the double-top chart pattern.
The reverse of the double-top trading patterns occurs at the base of a price chart. The chart patterns in forex signify waning short-selling pressure. Sellers try to push prices lower but fail, resulting in two lower bottoms.
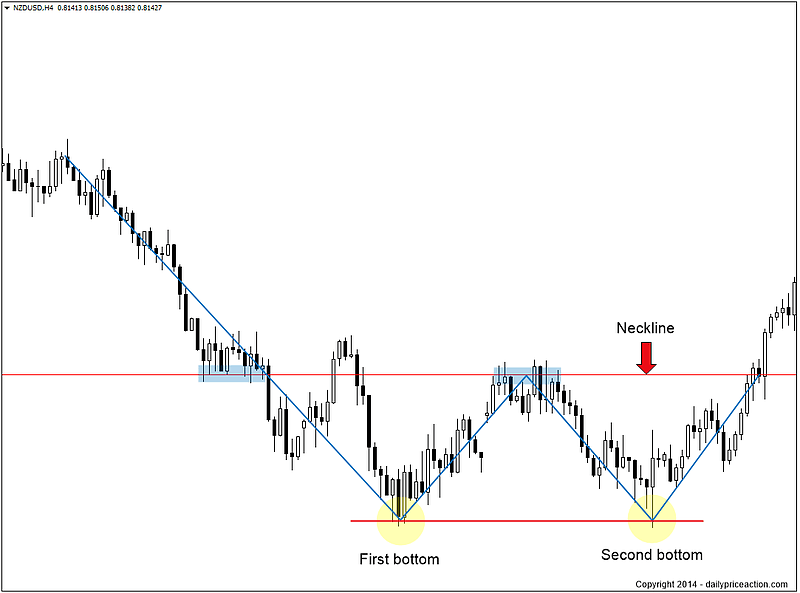
Source: Dailypriceaction.com
Price moving up after the double bottom formation and breaking out of the resistance level or neckline affirms a change in market sentiments from bearish to bullish. Consequently, the price often breaks out to the upside, providing ideal opportunities to enter buy positions.
A cup and handle pattern is a bullish continuation pattern that indicates a period of bearish market sentiment before the market turns bullish. At first, prices tend to move lower before hitting a support level, resulting in a round-shaped bottom. The round-shaped bottom affirms waning short-selling pressure as bears struggle to push prices lower.
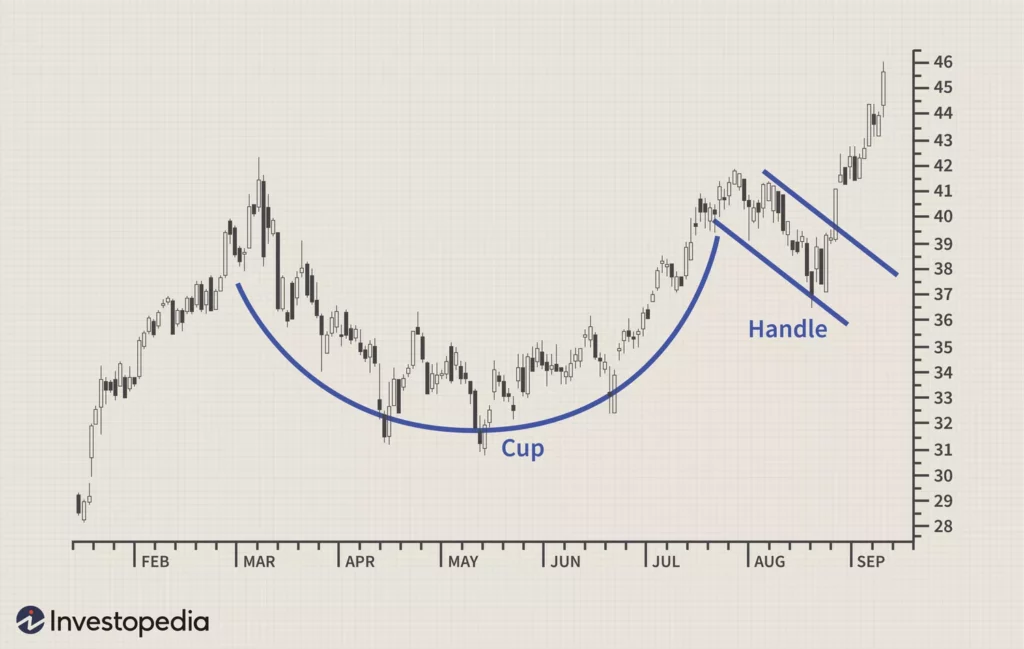
Source: Invetsopedia.com
The cup appears as the price bottoms out of the round bottom and moves up. However, instead of price edging higher after bottoming out, there is usually short-term retracement whereby the price moves lower before breaking out to the upside resulting in the handle-like pattern.
Once the price reverses course from the handle, it allows buyers to open a buy position as it affirms the price is likely to make higher highs.
Price action in the forex market gives rise to various trading patterns. The chart patterns in forex provide insight into whether the price will continue moving in the underlying trend after consolidation or reverse course and move in the opposite direction. Triangles, engulfing, double top and double bottom, Cup and Handle and head and shoulder are some of the most popular chart patterns in forex trading.
What is a triangle chart pattern and how does it work? Figure out the types of triangle chart patterns and how to trade them with profit on FX2 Blog.
Do harmonic patterns work? Should you use them for trading? Check out the most popular harmonic patterns and tips for harmonic trading on the FX2 Blog.
In this FX2 article, we describe types of Japanese candlesticks, and explain how to read them. Check out our tips on how to trade Japanese candlesticks.
Bull vs. bear flag: find out how do they differ and how to identify them. Read about trading bull and bear flag patterns on the FX2 Blog.
4 most popular continuation trading patterns that every trader should know. Check out types of continuation patterns and read about bullish and bearish continuation candlestick patterns on the FX2 Blog.
6 most popular reversal trading patterns that every trader should know. Double top and bottom, engulfing pattern, and other Forex reversal patterns on the FX2 Blog.
Read about key differences between chart patterns and candlesticks. Find out types of chart and candlestick patterns on the FX2 Blog.