The financial market is home to some of the most volatile securities that experience wild price swings throughout a trading day. Consequently, it’s become much easier for traders to try and profit from small price changes as prices oscillate up and down. Scalping is one of the popular trading strategies leveraged by retail, institutional and high-speed trading systems to take advantage of small price changes.
What is Scalping
Scalping is a strategy whereby traders and trading systems open and close positions within minutes or seconds while trying to take advantage of small price movements. The focus is to try and make as many trades as possible on any given day while locking in small profits with each position. Consequently, the focus is on high volumes of small profits.
Scalpers focus on accumulating small profits with each trade rather than letting any winners run. The strategy is to generate many small profits from many trades rather than waiting for a significant profit with one trade.
Given that the number of trades made is so large, scalping requires high discipline. For example, a trader or system must have well-defined rules for opening and closing positions. Likewise, one must avoid a large loss that would wipe out profits generated by dozens of trades already made.
Since the amount of time spent in the market with each trade is minimal, traders leverage various strategies to try and profit from the slightest price movement.
Momentum Scalping Strategy
With this strategy, traders take advantage of the slightest changes in market momentum. Whenever the market turns bullish, they open buy positions and sell positions when the momentum turns bearish. Stochastic is one of the indicators that help ascertain prevailing market momentum.
The stochastic indicator compares the current price of a security with its range over a set period. By comparing the two prices, the indicator provides potential turning points whereby scalpers can expect significant price movement on momentum changes.
The indicator comes with readings between 0 and 100. The underlying instrument is considered overbought whenever the indicator reading is above 80, meaning it’s been bought too much or the price has increased significantly. Consequently, the prospect of price correcting and moving lower is usually high on momentum shifts from bullish to bearish.
Scalpers pay close watch to the stochastic movement to ascertain ideal entry points. For example, whenever the stochastic reading is above, 80 traders look to enter a short position in anticipation of the price correcting and moving lower. Similarly, whenever the stochastic reading is below 20, scalpers look to enter a buy position in anticipation of momentum turning bullish.
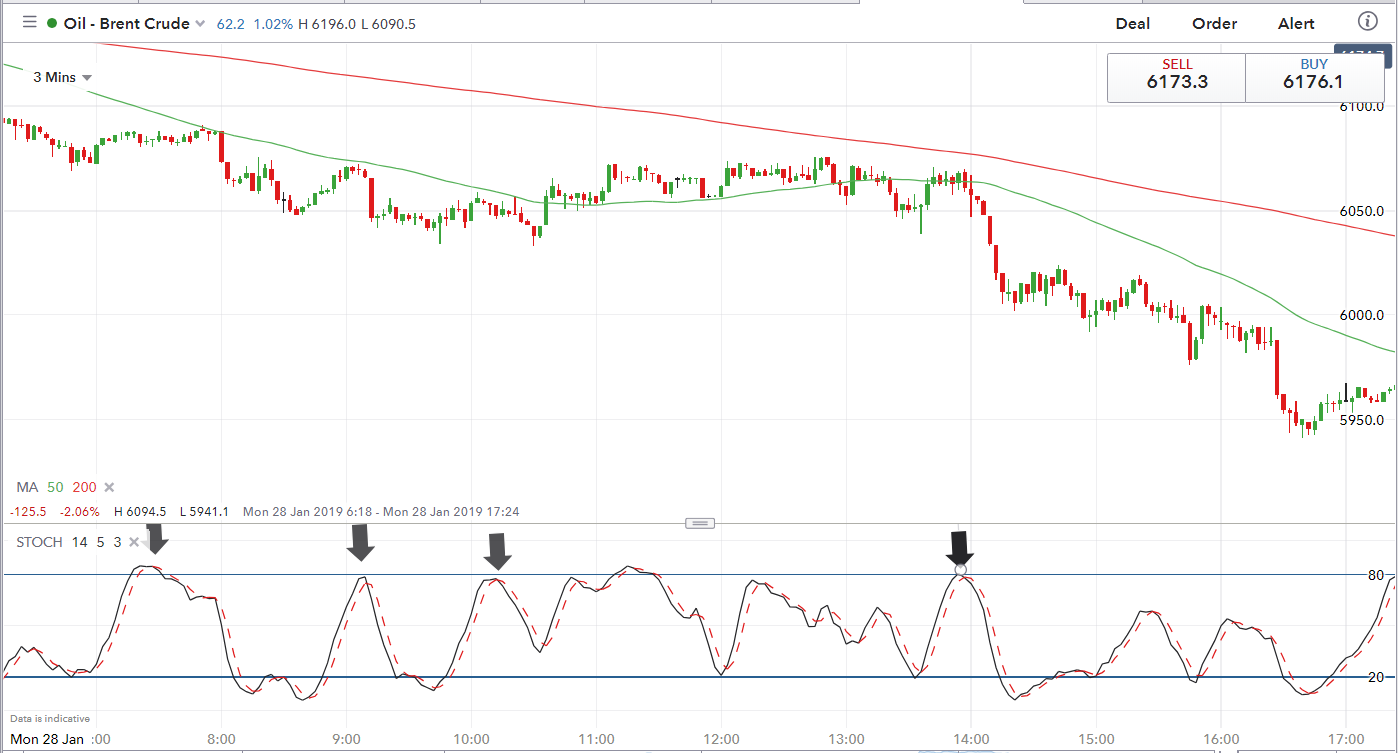
Source: IG.com
In the oil brent chart above, it is clear that as soon as the stochastic reading rose close to the 80-level, the oil price tanked, providing an opportunity for scalpers to trigger short positions. The traders rode the wave down and only exited as soon as the stochastic reading tanked below 20. The process of selling with stochastic close to 80 and exiting when it tanks below 20 is repeated continuously.
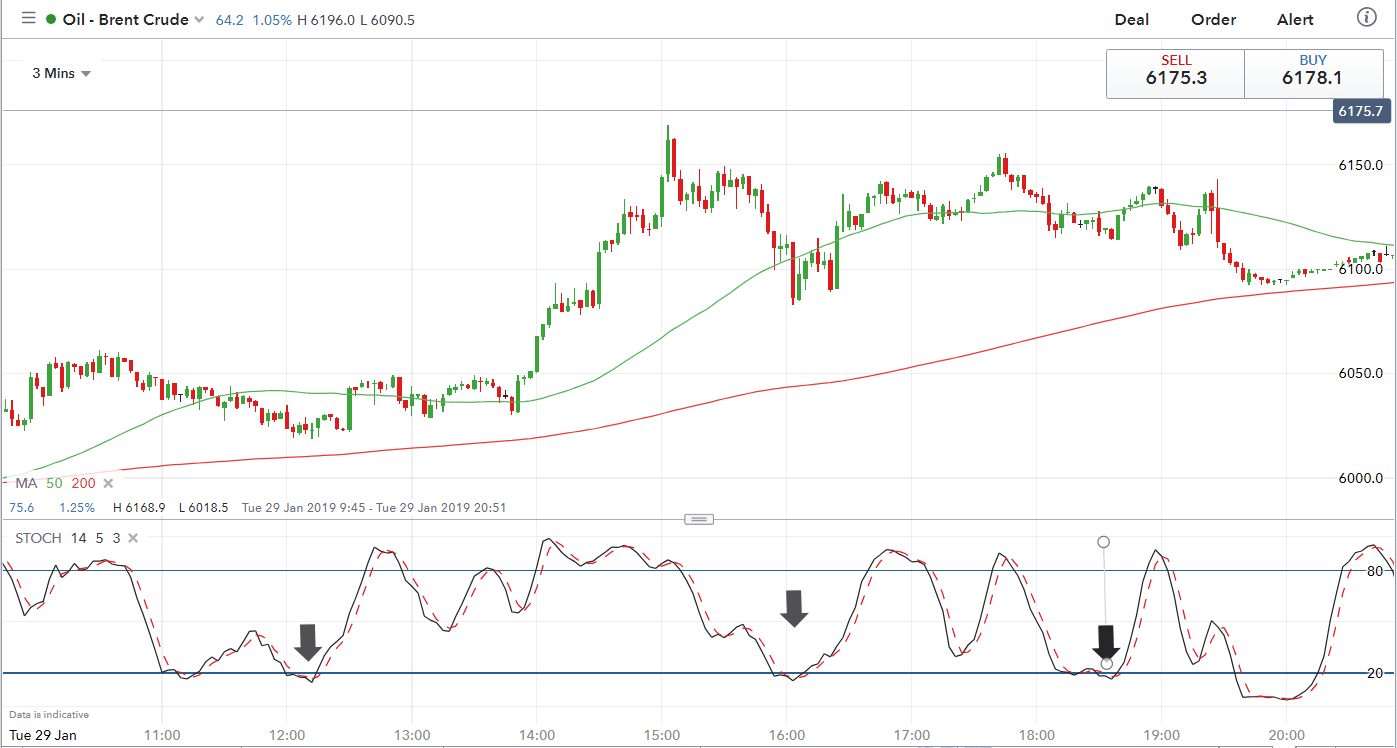
Source: IG.com
The oil price chart above clearly shows that whenever the stochastic indicator tanked below the 20-level, oil price bounced back, providing an opportunity for scalpers to trigger a buy position. The trade was left to run until the indicator rose above 80, signaling it was time to exit.
Trend Following Scalping Strategy
The moving average is another important trend indicator used in scalping. The indicator provides the average price of the underlying asset over a given period. It signals that the security price is increasing. When the indicator falls, the underlying asset price declines.
In the moving average scalping strategy, traders use three indicators. The first is a long-term moving average, such as the 200-day moving average, used to indicate the direction price is moving. The other two are short-term moving averages used to indicate entry and exit levels in the market. In this case, we will use a 5-day and 20-day moving average to signal the entry and exit levels while scalping.
Consequently, if one is trading on a five-minute chart, whenever the price is above the 200-day moving average, it is considered to be in an uptrend. In this case, traders look to enter long or buy positions as the price is expected to increase.
The buy signal comes into the fold whenever the 5-day moving average moves above the 20-day moving average. When the crossover happens, it implies it is time to open a buy position in anticipation of a price rising.
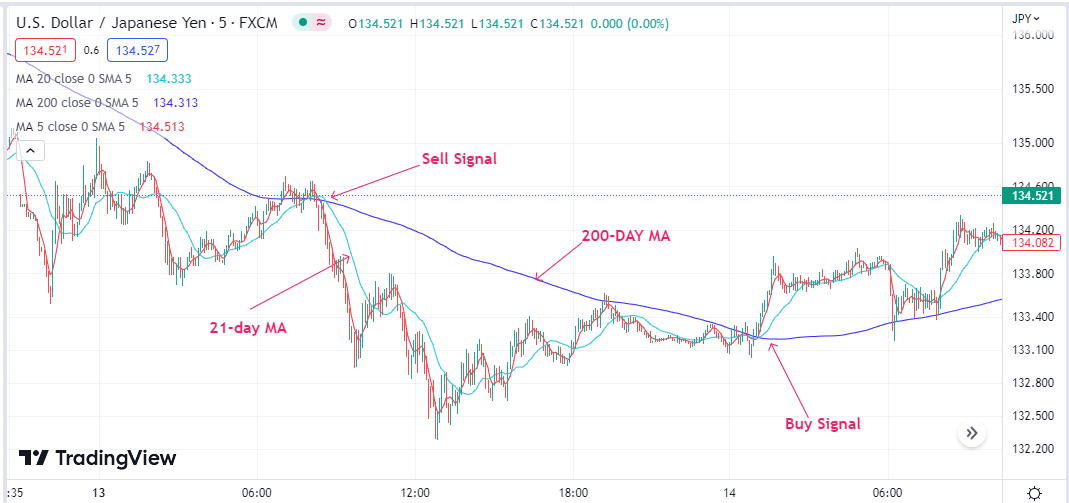
Source: Tradingview.com
The trader can leave the position open if the price exceeds the 5-day moving average. Conversely, the position can be closed to lock in profits as soon as the price moves below the 5-day moving average, as it would imply a shift in momentum from bullish to bearish.
Conversely, a sell signal comes into play when the price moves below the 200-day moving average. As long as the price remains below the long-term MA, it implies bearish momentum signaling that short sellers are in control and likely to continue lowering prices.
The opportunity to sell will come on the 5-day moving average, moving below the 20-day moving average, as it will imply a strong bearish momentum. A trader can leave the short or sell position open if the price is below the 5-day moving average. The position can be closed to lock in profits as soon as the price moves and closes above the 5-day moving average, implying a shift in short-term momentum from bearish to bullish.
Parabolic SAR Scalping Strategy
The parabolic SAR is another popular indicator used in scalping strategy as it provides reliable signals on when to go long or short in the market. The indicator comes with dots at the top and bottom of the market price.
Whenever the price rises to the red dots, it implies an overbought condition signaling potential reversal as buyers won’t be willing to buy at the extremely high position. Consequently, when the price is close to the red dots, it signals the need to enter a sell position, as a reversal would likely occur, resulting in the price edging lower. The formation of a red bearish candlestick close to the red dot affirms the need to enter a short position.
A trader can leave the sell position open for as long as it continues edging lower and there is no formation of blue dots below the market price.
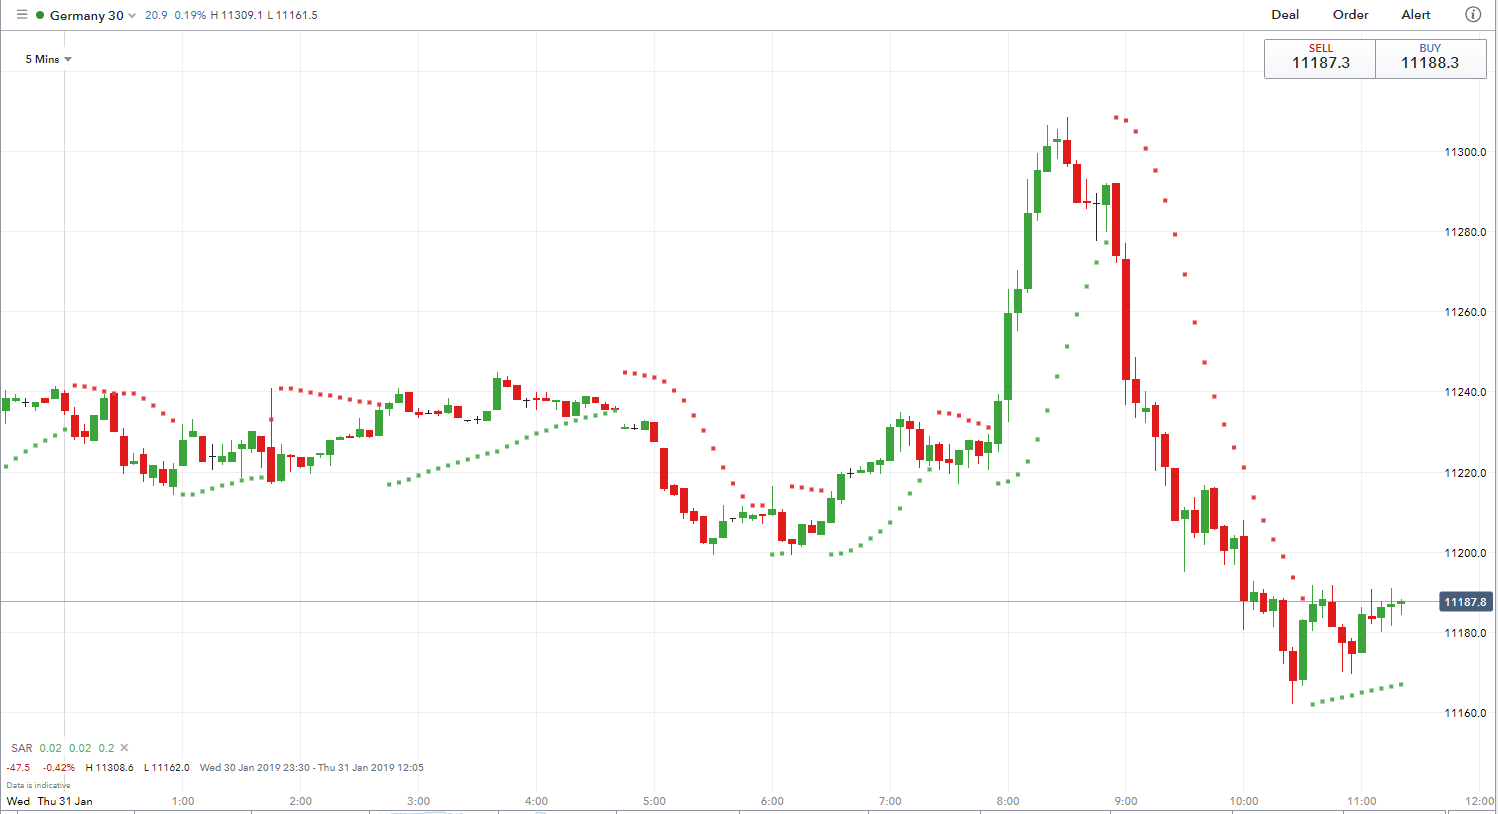
Source: IG.com
On the other hand, a buy signal comes into the fold as soon as blue dots appear below the market price. The blue dots imply a potential upside reversal as the asset price is considered sold too much. Consequently, scalpers can look to open a buy position as soon as blue dots appear and a bullish candlestick forms near the dot.
The signal to exit or close the buy position would come whenever the price rises significantly and the red dots appear above the market price. The emergence of the dots above market price signals a shift in momentum from bullish to bearish.
Bottom Line
While scalping is one of the most popular trading strategies, it requires lots of discipline. A trader should have well-cut entry and exit rules. It’s the only way to stay objective and squeeze as many small profits as possible. Nevertheless, the trading strategy is highly demanding as it requires traders to spend lots of hours glued to the screen in such potential small price movements.