Price patterns provide valuable insight into the prevailing market sentiment, and the direction price is likely to move. The reversal patterns in Forex are broadly classified into three categories: reversal, continuation, and uncertain patterns.The price patterns come into play depending on the prevailing market sentiments.
What is a Reversal Pattern?
A reversal pattern is a price pattern that marks a turning point between rising and falling prices. It hints at potential changes in the direction of price movements. For example, if prices were increasing, the appearance of reversal patterns signifies that a change in direction to the downside could be in the offing. Similarly, if prices were dropping and a top reversal pattern occurred, it might as well signal that the price is about to bottom out and start increasing.
How Do Chart Reversal Patterns Occur?
Candlestick reversal patterns occur whenever there is a significant change in market momentum. For example, if the prevailing momentum were bullish, resulting in prices making higher highs, a shift in momentum from bullish to bearish would eventually result in prices dropping and starting to make lower lows.
Likewise, if prices were dropping, signifying strong bearish momentum, whenever reversal candlesticks occur, they imply a change in momentum from bearish to bullish. Consequently, prices will eventually bottom out and start moving up, making higher highs.
Reversal patterns are classified into two categories. Bearish Reversal Patterns occur whenever prices increase and start moving lower, affirming a change in momentum from bullish to bearish. Bullish Reversal Patterns occur whenever prices are moving lower and start moving up, confirming a shift in momentum from bearish to bullish.
Below are some of the top reversal patterns in forex
Double Top and Double Bottom
A double-top reversal pattern occurs when the price has increased significantly to levels where overbought conditions kick in. Once the price hits a strong resistance level, it struggles to move up further, resulting in the first top.
Afterward, prices drop, but buyers come into the fold and try to push prices up. However, failure to push the price above the previous high results in strong rejection from short sellers, who push the price lower.

Source: Tradingview.com
The emergence of two tops at the resistance level affirms a buildup in selling pressure confirming the prospects of price edging lower as short sellers have overpowered bulls. Once the price breaks the neckline or support level, it affirms a double top signaling price is well poised to drop.
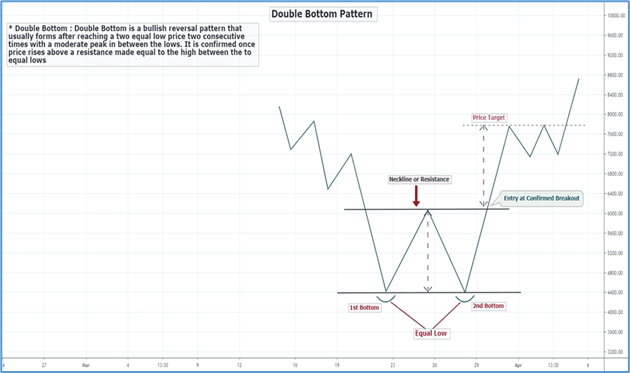
Double bottom, on the other hand, occurs after the price has dropped significantly, triggering oversold conditions. Once the price hits a strong support level, buyers flock to the market and try to buy at the new lows. The result is a bounce back in price from the recent lows.
Source: Tradingview.com
Nevertheless, short sellers don’t lose hope and try to push prices lower after the bounce back. Failure to push the price below the previous low results in the formation of two bottoms at the same level. Once buyers notice short sellers are struggling to push prices lower, they flock to the market and push prices higher following the double bottom formation.
Once the price breaks above the resistance level above the two bottoms, it affirms a breakout, signaling the price is likely to increase. Consequently, it presents an opportunity for traders to open buy positions.
The double bottom is complete once the price breaks above the trigger line.
Bullish and Bearish Candlestick Reversal Patterns
Bullish and Bearish engulfing patterns are the most popular and common chart reversal patterns. The two stand out as they are easy to detect and are made up of two candlesticks.
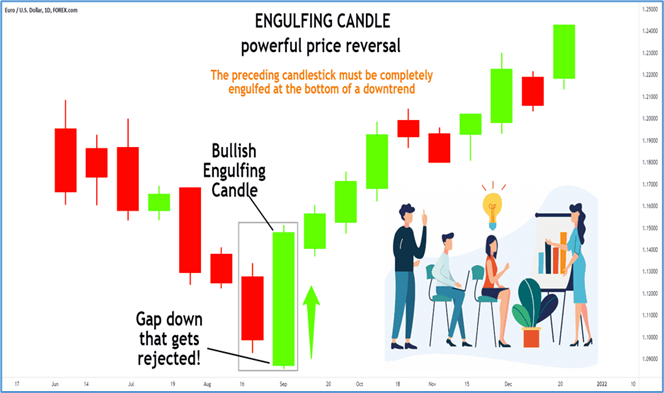
The Bullish Engulfing reversal price patterns occurs during a downtrend as short sellers continue to push prices lower. However, after the price has tanked significantly, the short-selling pressure tends to wane as buyers start to flock to the market.
Source: Tradingview.com
Once the price hits a strong support level, buyers flock to the market, buying the new lows and pushing the price higher. The result is the formation of a large bullish candlestick that engulfs the previous bear candlestick.
The formation of a large bullish candlestick that engulfs the bearish candle affirms bulls have overpowered bears and are poised to push prices higher away from the underlying downtrend.
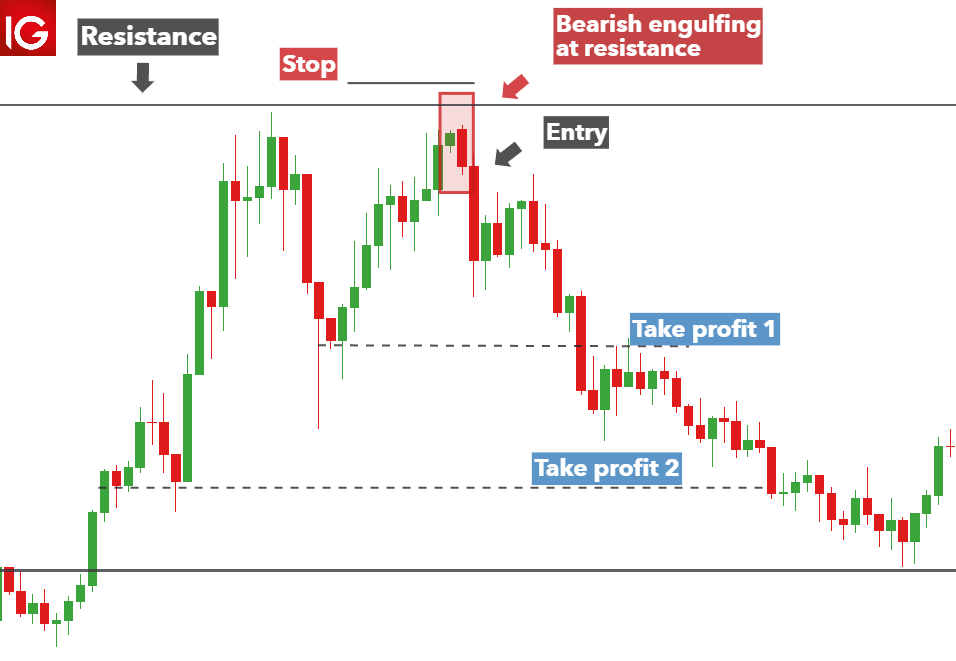
The bearish engulfing is a top reversal pattern that occurs after the price has increased significantly. There reaches a point where buyers start to exit due to waning upward momentum. As the upward momentum fades, bears flock to the market and try to sell at the new highs.
Source: Tradingview.com
The formation of a large bearish candle that engulfs the previous bullish candle affirms a change in momentum from bullish to bearish. Price often drops as short sellers enter the market and sell after the large bearish candlestick closes.
Head and Shoulder Reversal Trading Pattern
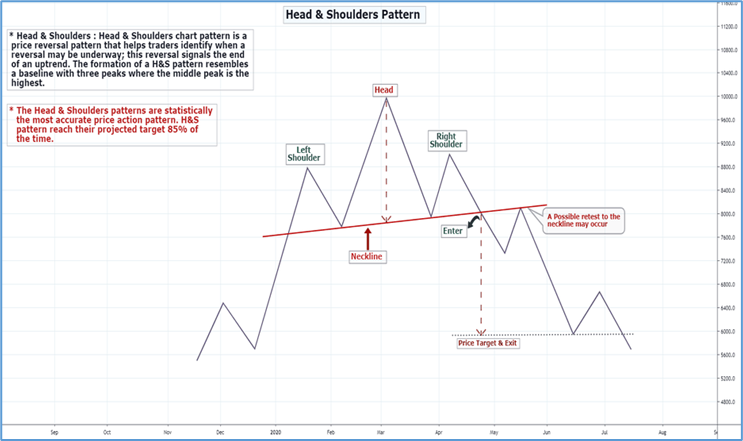
The head and shoulder pattern occurs when prices are rallying with significant momentum. It comprises the first peak, the first shoulder, followed by a slight pullback, after which the price rises and forms a new peak or the head. However, the price pulls back from the new peak to the initial support.
Source: Tradingview.com
The price bounces back from the neckline but does not rise a the new peak. Instead, it faces strong resistance at the same level as the first peak resulting in the second shoulder. In the end, one ends up with a head, the peak, and two shoulders on either side of the peak at the same level.
Whenever this pattern forms, it affirms waning upward momentum. Consequently, sellers use the opportunity to enter a short position as soon as the price breaks the neckline or support level and starts moving lower.
The Inverse Head and Shoulder Pattern
It is one of the best reversal candlestick patterns for anyone looking to buy low and benefit from prices bouncing back and moving up. It occurs during a downtrend when the price drops, forming the first shoulder on the left. Once the price bounces back, it is immediately followed by a strong sell-off which results in the price falling and forming a new low, which is the head.
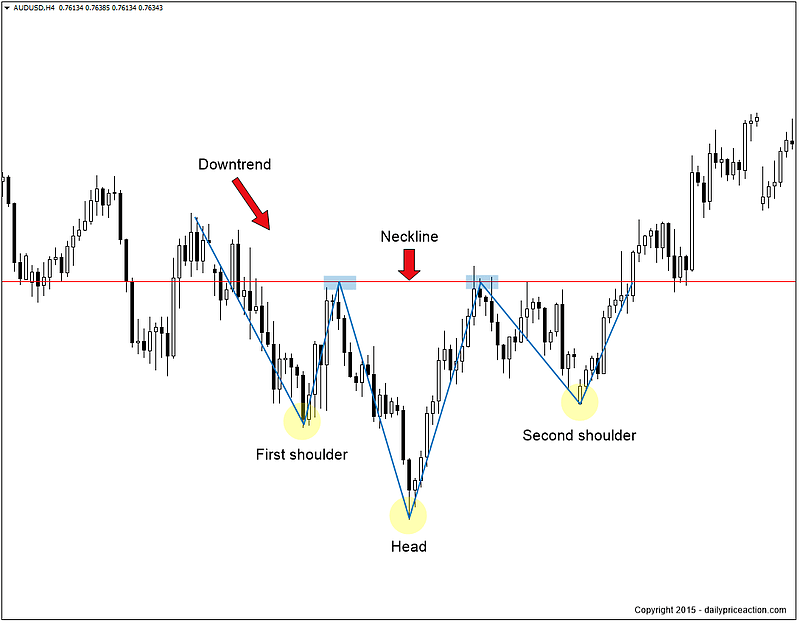
Nevertheless, the price bounces back and is immediately followed by a strong sell-off at the neckline. Short seller’s failure to push the price below the previous shoulder confirms waning bearish momentum. The formation of the right shoulder is at the same level as the left shoulder.
Price powering through the neckline from the right shoulder confirms the change in momentum from bearish to bullish. Consequently, bulls use this opportunity to buy low in anticipation of prices increasing.
Bottom Line
Reversal patterns are some of the best chart patterns that allow traders to open positions when a new trend is just starting. The bullish and bearish reversal patterns occur at support and resistance levels, signifying the underlying trend’s waning momentum. While looking to profit from reversal candlestick patterns, it is vital to deploy risk management strategies to avoid being caught off-guard by failed breakouts.