Traders use bullish and bearish flag patterns trading, two well-liked technical analysis tools, to identify possible price persistence or reversal trends in financial markets. Identifiable by their distinctive forms that bear resemblance to flags, these patterns require knowledge of how to read and trade to efficiently navigate volatile market conditions.
A forex flag pattern in forex trading is a consolidation that follows a major price move. It typically has the appearance of a flag atop a pole, signifying that the previous trend may continue.
In this article, we’ll discuss the trading strategies for both bullish and bearish flag patterns.
Bull Flag vs. Bear Flag
Recognizing a bull flag vs bear flag trading pattern is comparable to analyzing mood fluctuations in the market. When a stock stops following a strong upward run, it can create a bull flag, which is a flag-like creation that indicates possible upward continuation. It resembles the market taking a moment to regroup before surging forward.
On the other hand, a bear flag appears when a stock pauses following a sharp decline, rising flag pattern of bear flag that suggests potential future declines. These patterns are closely tracked by traders, who use them as hints for predicting future price trends.
Bull Flags
Bull flags reflect the market’s method of relaxing after a gallop. Consider a great upward momentum in the stock price, followed by a momentary stop to collect its breath before maybe going further. This brief suspension creates a pattern resembling a flag, as the price settles within a small range.
For traders, this is a bullish indication that the uptrend may be about to restart. Frequently, they hold off on taking advantage of the anticipated upsurge until they have confirmation, such as an increase above the top boundary of the flag.
In the context of forex, a bull flag forex is a bullish continuation pattern, characterized by a period of consolidation which occurs after an upward price movement. A forex bullish flag is often taken by traders as a sign of upcoming gains.
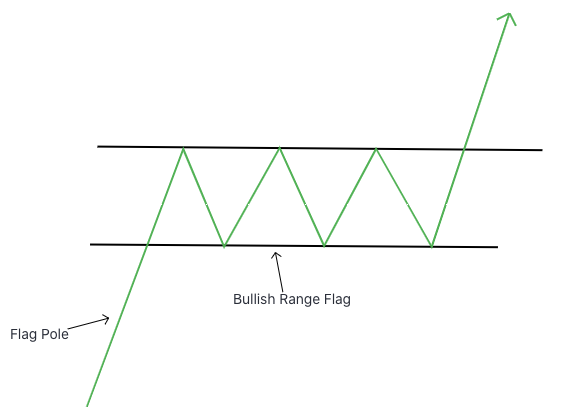
Although flag patterns come in all different shapes and sizes, every flag pattern has two parts: a flagpole and the flag. In a bullish chart, the three main bull flags are:
1. Bullish range flag. Notice how the old price action on the left looks like an ascending pole. That is the impulse trend of the market. The price then begins to range sideways before it continues moving upward. That is the flag that signals a temporary pause in the upward trend. Once the price action breaks past the range’s resistance and continues higher, that’s the signal to hit buy in continuation of the trend.
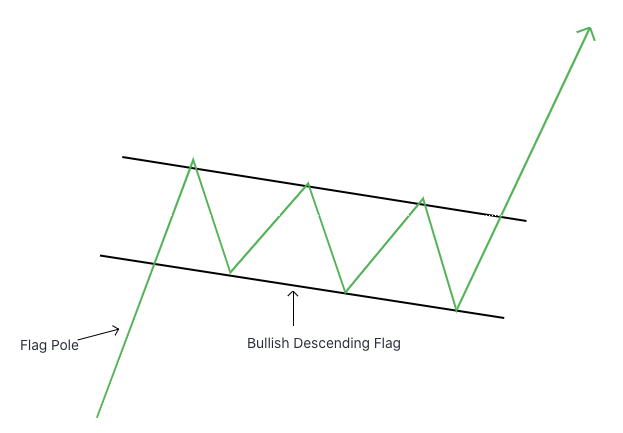
2. The next bullish flag is the descending channel flag. Here we have another ascending flagpole on the left but this time the pause in the uptrend is more drastic, as we start to see lower highs and lower lows. But with the lower highs and lower lows, we’re still noticing a symmetrical channel that’s descending. This descending channel is the flag. Once the price action breaks up past the resistance of the channel, we have a signal to hit buy in continuation of the uptrend.
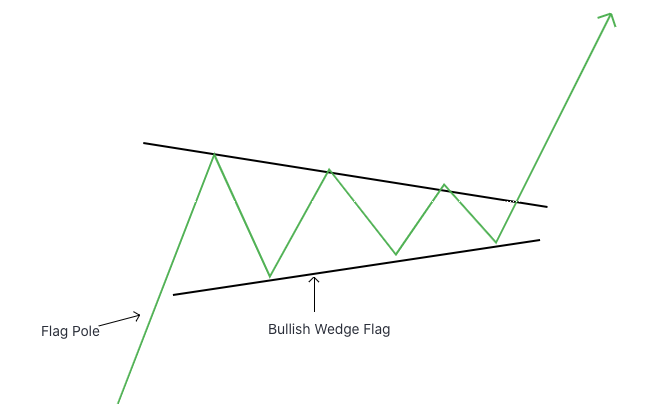
3. Finally, we have the bullish wedge flag. In this pattern we will notice the same impulse move upward, which is represented by the ascending flagpole. Then price action pauses and starts to cluster, seemingly unsure if it will go higher or lower. In the wedge, the highs are getting lower and the lows are getting higher. This type of price action is a sign of building pressure. Once the price action breaks upward, we have a signal to buy in continuation of the trend.
Bear Flags
Bear flags have similarities to a market’s temporary shelter in a storm. Consider a stock price crashing dramatically, then taking some time to recover before potentially plunging even more. The halt creates a flag-shaped pattern, with the price stabilizing within a small range but rising slightly upwards.
Traders perceive this as a bearish indication, implying that the decline may resume following the momentary break. They frequently wait for confirmation, such as a breakthrough below the flag’s lower boundary, before executing short positions or other techniques to capitalize on the expected downward movement.
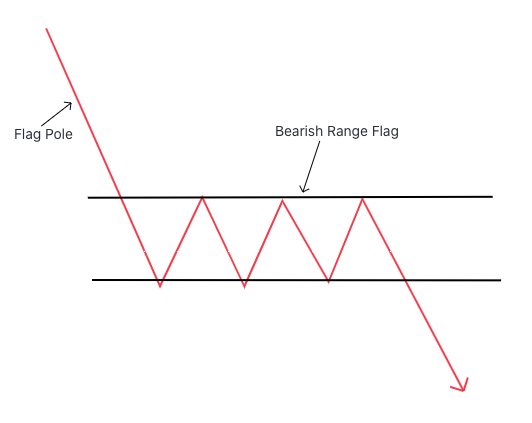
There are three main types of bear flags:
1. Bearish range flag. Notice here how the old price action on the left looks like a descending flagpole. That is the impulse down-trending move of the market. Then price action starts to range sideways before it continues moving downward. This range is the flag that signals a temporary pause in the downward trend. Once the price action breaks past the range’s support and continues lower, we have a signal to hit sell, in continuation of the trend.
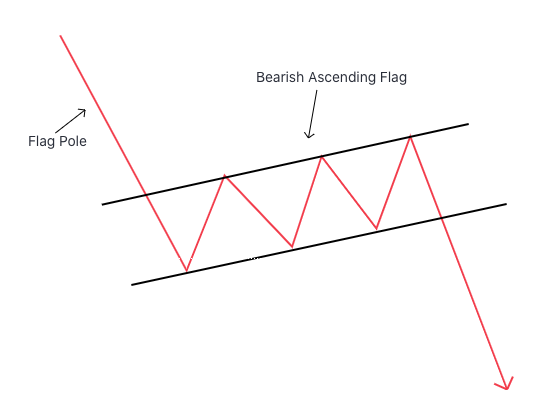
2. The next bear flag is the ascending channel flag. Here we have another descending flagpole on the left, but this time the pause in the downtrend is more drastic, as we start to see higher highs and higher lows. But with the higher highs and higher lows, we’re still noticing a symmetrical channel that’s ascending. This ascending channel is the flag. Once the price action breaks down past the support of the channel, we have a signal to sell in continuation of the down-trend.
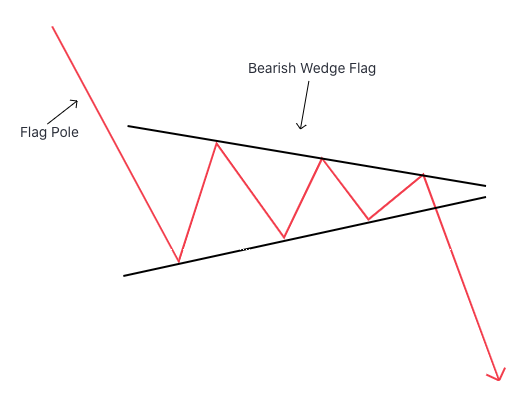
3. Then we have the bearish wedge flag. In this pattern, we have the same impulse move down that is represented by the descending flagpole. Then the price action pauses and starts to cluster, not sure if it will go higher or lower. In the wedge, the highs are getting lower and the lows are getting higher. This type of price action is a sign of building pressure. Once the price action breaks downward, we have a signal to sell if the trend continues.
It’s important to note that a setup always needs a confirmation signal. In other words, even after identifying a flag pattern, a good trader has a signal – either a specific candle or maybe a set of candles – that he’s looking for before executing the trade.
Pros and Cons of Trading Bullish and Bearish Flag Patterns
Bullish and bearish flag patterns trading have multiple advantages and disadvantages. One advantage is their consistency as technical indicators. These patterns are popular among traders and provide straightforward signals of possible price continuance or reversal. They provide distinct entry and exit points, enabling traders to better plan their bets and manage risk. Furthermore, these patterns frequently provide the opportunity to achieve substantial earnings goals, particularly when paired with other technical analysis methods.
However, there are also some negatives to consider. One major downside is the likelihood of false break out. Prices may look to break out of a forex flag pattern, only to reverse direction shortly afterwards, trapping traders in losing positions. In addition, the sensitivity of flag patterns to market situations might be problematic. In unstable or choppy markets, the predictability of these patterns might decrease, causing more confusion for traders.
Moreover, effective risk management is vital while trading flag patterns. While the potential for profit is higher, losses can occur if deals are not planned and executed carefully. To minimize the impact of adverse market moves, traders need to maintain discipline while setting stop loss orders and regulating position sizes. In summary, trading bullish flag trading patterns and bearish flag trading patterns offers profitable possibilities with obvious entry and exit locations.
However, traders must know how to trade breakouts, market sensitivity, and the significance of risk management in order to successfully navigate various market conditions.
How to Draw Bullish and Bearish Flag Patterns?
To draw bullish and bearish flag patterns on a chart, you have to first recognize the specific components that define each pattern. To identify a bullish flag, seek out a significant rising in the price movement, also known as the flagpole.
After that, search for a period of consolidation where the price trades in a narrowing range, forming the flag portion. The flag boundaries originate by connecting the consolidation phase’s highs and lows.
Lastly, look for a potential breakout over the flag’s upper boundary to confirm the bullish continuation candlestick patterns. Similarly, designing a bearish flag forex starts with recognizing an extreme downward price movement, which forms the flagpole.
Then, observe a period of consolidation marked by a decreasing price range, resulting in the flag. Connect the highs and lows of this consolidation to form the flag boundaries. Anticipate a possible breakthrough below the flag’s lower boundary as confirmation of the bearish price action trend. Visual examples or illustrations can assist traders in understanding the structure and development of bullish and bearish flag patterns on a price chart.
How to Trade the Bearish Flag Pattern
One must wait for the price to demonstrate that the downtrend is still in place before trading the bear flag pattern. First, recognize the bearish flag formation, which is defined as consolidation phase (the flag) following a sharp decline in the price (the flagpole).
As soon as traders detect the pattern, they search for a potential breakout below the bottom border of the flag, which would validate the bearish continuation. Then, keeping in mind the significance of risk management to guard against any false breakouts or market reversals, they might consider short positions or other bearish trading methods.
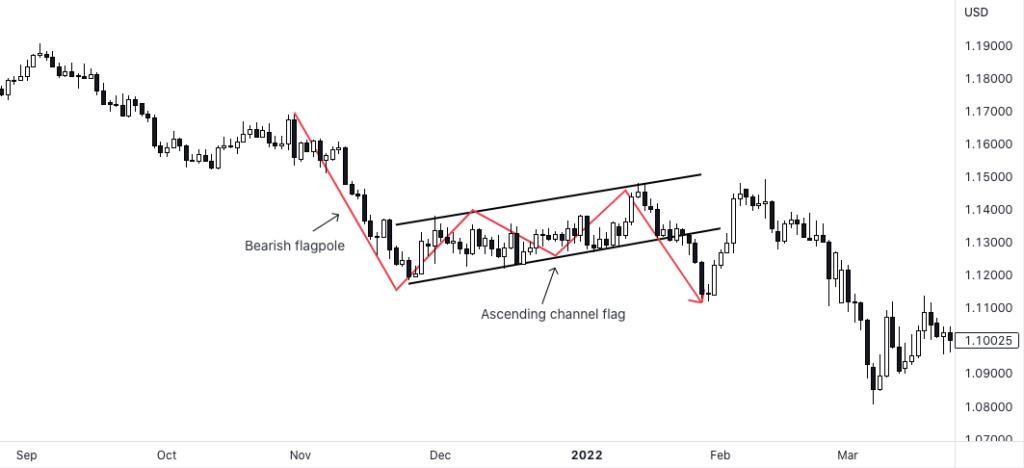
Take a look at this bear flag on the Daily chart of the EUR/USD. Notice the flagpole and the channel. Note how the last 4 candles in the channel before the price action continued downward were all small candles. The market was clearly indecisive for those last four days before it broke out. That “pressure” might be a signal for a trader that the channel is coming to an end and the market will continue downward.
Trading the Bullish Flag Pattern
Gaining from a potential continuation of upward momentum is the trading approach for the bullish flag pattern. When there has been a substantial rise in prices (the flagpole), traders look for a consolidation face (the flag) during which the price moves within a contracted range.
After discovering the pattern, traders look for a breakout over the flag’s upper boundary as proof that the trend is still bullish. Then, keeping an eye out for false breakouts and using risk management techniques to optimize possible gains, they might think about long positions or other bullish trading techniques.
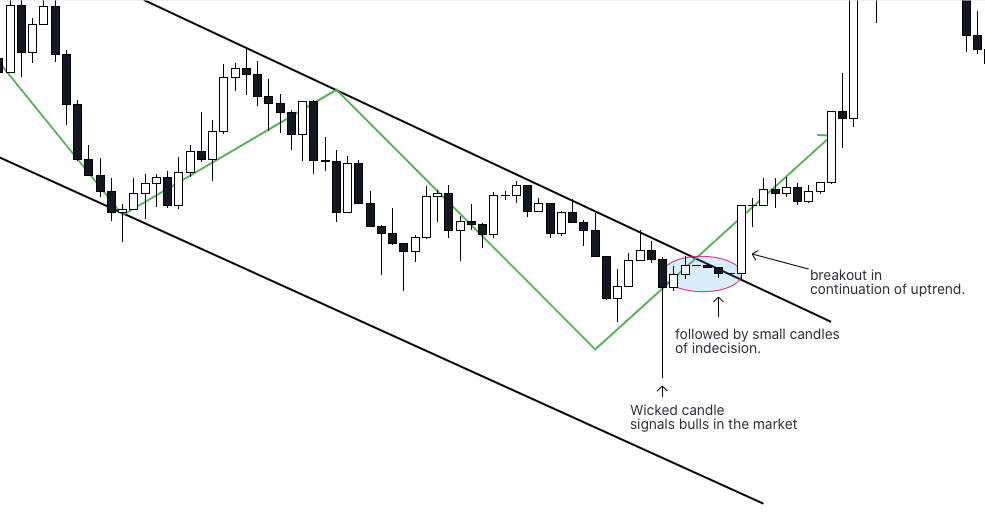
Here’s an example of a bullish descending channel flag from the CAD/JPY 5M chart. Here again you see the ascending flagpole followed by the descending channel flag and then the breakout:
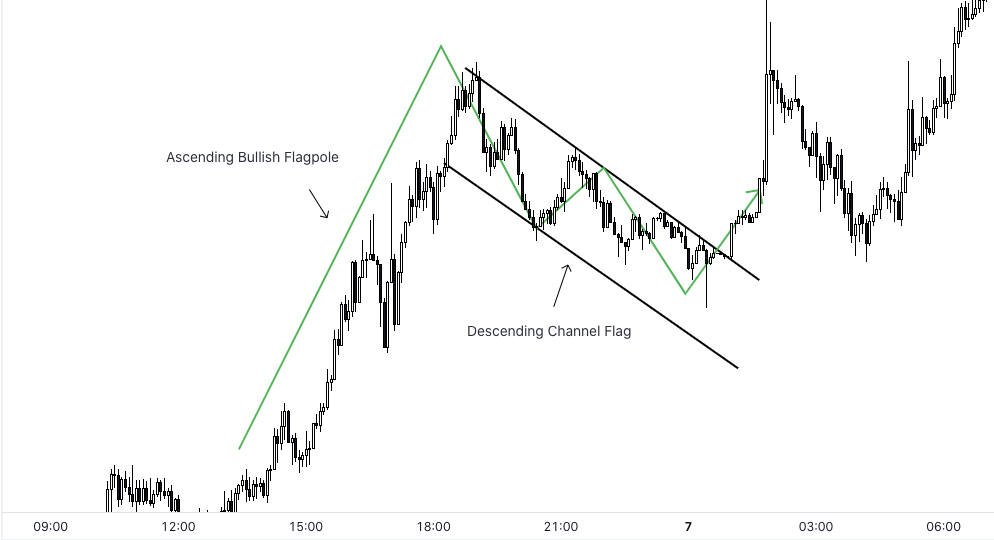
Let’s take a closer look at the breakout and we can see some clues of it coming. Notice how the lows in the channel were ascending. Then there was a big wicked candle showing bullish pressure. After that wick, there was clear indecision in the market right at the top of the channel followed by the breakout.
Identifying these patterns is the first step in trading them, but for a higher winning percentage a trader wants to find clues and signals within the candles themselves to give himself a better edge.
Common Mistakes and How to Avoid Them
Traders often make various mistakes when trading bullish and bearish flag patterns, which can result in losses. One error that might result in bad trading decisions is assuming other chart patterns for flags. Traders should fully comprehend the characteristics of flag patterns trading and utilize supplementary technical analysis strategies to verify their reliability in order to prevent this. Traders should also be aware of how to identify trending market.
Premature trade entrance or exit based on inadequate pattern confirmation is another common mistake. Before taking a position, traders should wait for apparent breakout signals above or below the flag borders. They ought to keep away from quitting too soon out of impatience or a fear of losing money.
Another problem with insufficient stop-loss placement is that it subjects traders to large losses if the transaction moves against them. Stop-loss orders placed beyond the borders of the flag pattern can assist reduce risk and protect cash in the case of unanticipated price reversals. Another common mistake is overtrading, in which investors place a great deal of bets based on a variety of false signals or flag patterns, splitting their attention and raising their risk exposure. Traders should focus on high-probability situations, be patient, and value quality over quantity to prevent overtrading. In order to minimize the probability of making these errors, traders should follow disciplined trading strategies, carefully review flag patterns, wait for solid confirmation signals, properly position stop-loss orders, and prevent from overtrading by being selective.
Furthermore, ongoing instruction and expertise can assist traders in polishing their craft and enhancing their capacity to successfully negotiate the complicated nature of flag pattern trading.
Happy Trading!
We hope this lesson in bull flags and bear flags helps you develop that edge you’re looking for. Always remember that the trend must take a pause before continuing. Successful traders don’t chase the trend but wait for pullbacks. Then they identify patterns, like these flag patterns and finally they see a confirmation candle, or set of confirmation candles, before triggering and opening their winning positions.
Remember to approach the markets with patience, discipline, and confidence as you start your trading journey. Keep an eye out for chances, but be mindful of the risks as well. Prioritize risk management at all times, and protect your money by setting suitable stop-loss limits.
As you gain expertise, never stop learning, adapting, and improving your trading techniques. Above all, have joy with the process! Every deal is a chance for development and progress, regardless of the level of success or difficulties you experience.
We wish that your trading attempts bring you happiness and successful trades.