Order Flow Analysis: How to Use Order Flow in Forex Trading
Published on
March 6, 2023
Traders conduct technical and fundamental analysis to understand price action and predict the direction price is likely to move. Technical analysis entails the use of indicators to try and understand market momentum. On the other hand, fundamental analysis is the study of economic data to try and understand price action. While the two are commonly used analysis, they fail to explain why price behaves a certain way at key price levels. Order flow analysis provides reliable information on traders’ key price-level actions.
What is Order Flow
Order Flow refers to the number of market orders waiting to be executed at a given price point. Traders tend to place pending orders waiting to be executed at support and resistance levels. For instance, whenever the price rises, it means more buyers than sellers place buy orders, thus pushing prices up.
However, after a significant move up, the upward momentum tends to fade as buyers become wary and start locking in profits as the price approaches a fundamental resistance level. As buyers plan to exit the market, sellers use the opportunity to place sell positions at the resistance level in anticipation of getting rejected and moving downwards. Selling order flow at the resistance level amounts to an influx of bearish pressure.
Order flow chart analysis is a special kind of analysis whereby traders predict with relatively decent accuracy where most traders are placing opposite trades. It is also referred to as supply and demand analysis, which involves finding areas of imbalance in order flow charts.
It involves looking at where there was an intense battle between buyers and sellers in the past. Looking at big moves in the price order flow charts is the easiest way to spot areas of extreme order flow activity with the naked eye. Additionally, traders also rely on order flow indicators to get insight into what is happening in the market.
If the price is moving up, order flow chart analysis will pinpoint a level where short sellers plan to enter the market. This will trigger more selling activity, pushing prices lower. Likewise, if the price moves downward, the analysis will detail a level where buyers increasingly place buy positions in anticipation of the price bouncing back.
The Importance of Order Flow Analysis
Therefore, trading with order flow indicators can help predict where counter orders await at a future price level with a good amount of certainty. Consequently, it makes it easy to predict with some precision and confidence potential areas of price reversals.
In the financial markets, primarily in trading stocks, commodities, and futures markets, order flow charts pinpoint areas of order accumulation. It’s easy to determine such orders using volume order flow indicators, given the centralized nature of the market through which all orders pass.
On the other hand, the situation in the forex market is different, given the decentralized nature of the market. There is no reliable volume data that one can use to understand order flow in forex. In forex, it is completely different as no single broker tabulates all the orders following a given currency pair. The orders are distributed to a vast number of banks dealing with each other.
Order Flow in Forex
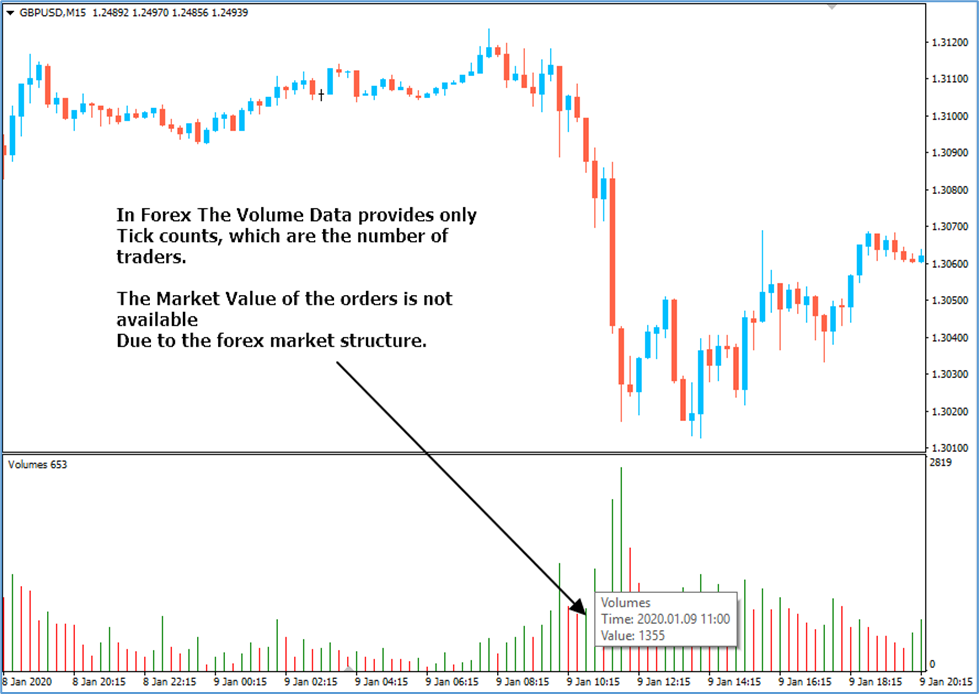
Nevertheless, it is still possible to understand order flow in forex with the help of previous price action activities. While volume order flow indicators don’t provide the true quantities of orders flowing into a currency pair, they provide reliable tick counts, which represent the number of trades flowing into specific brokers and not the entire forex market.
In forex, order flow charts are accumulated through tick counts. The tick count represents the number of traders placing trades at a given price level.
The GBPUSD order flow chart above clearly showed that GBPUSD was in a downtrend, making lower lows. After a significant move lower, the tick count starts building up, signals more traders are entering the market. Price bouncing with the formation of a double bottom signaled more buyers than sellers at the bottom of the chart compared to sellers who initially pushed prices lower.
As the price bounced back, the tick count increased, confirming more buyers in the market.
How to use Order Flow in Trading?
Understanding order flow is one of the easiest ways of gaining an edge in the market. Mastering how to read order flow also makes it easy to understand areas where strong price movements are likely to occur. Therefore, it becomes easier to buy at a very cheap price and sell at the highest and most expensive level.
How to Trade Order Flow: Buy Opportunity?
The order flow charts below show the Gold spot trending lower in the initial phase. However, upon price tanking to the $1685 level, short sellers come under pressure as buyers flock to the market and try to buy at the new lows. The $1685 level emerges as a key support or demand area, below which selling order flow is not in play.
Price tried plugging below the $1685 level but to no avail. What this means is that the $1685 mark is a crucial order flow level implying buyers are increasingly placing buy positions whenever the price nears this level.
While the price did bounce back significantly from the order flow imbalance level, selling order flow flocked to the market and pushed the price to around August 6. Going by what happened in the past, it is clear that the $1685 level is a key support level below which selling order flow does not materialize to push prices lower.
Additionally, it appears the $1685 level is a key area of interest whereby buyers place buy orders in anticipation of the price bouncing back after touching this level. After August 6, it is clear that the price did bounce back as bulls overpowered the selling order flow by placing more buy orders. Therefore, traders looking to profit from order flow analysis could have placed a buy order at this level in anticipation of the price rallying afterward.
In addition to placing a buy order, it is crucial to put a stop loss order a few pips below the order flow imbalance level. The stop loss order will close the position and prevent significant losses if the price reverses course and moves below the critical support level.
How to Trade Order Flow: Sell Opportunity?
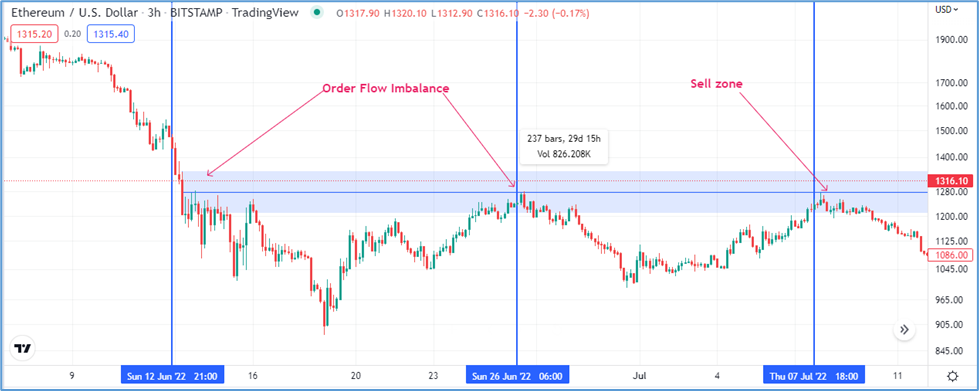
The Ethereum order flow charts below show a key area of order flow imbalance. It is clear that bulls lost momentum whenever the price rose near the 1280 level and struggled to push the price up. However, it is also clear that sellers used this opportunity to place selling order flow to push prices lower.
Consequently, the $1280 is a crucial order flow or area of solid resistance for bulls. Price action order flow at this level affirms a fundamental level of profiting from price edging lower afterward. Any trader who placed a sell position at this level ended up raking in significant pips on the price retreating and edging lower.
A stop-loss order can also be placed a few pips above the order flow imbalance level. The stop loss order will close the sell position and avert the risk of incurring significant losses. Its happend if the price bounces back and powers through the order flow imbalance level.
Order Flow Trading Strategy: Trading with Limit Orders
One of the best order flow trading strategies entails trading with limited orders. Limit orders allow one to place buy or sell orders in advance, triggering a position once the price corrects to a key area of order flow imbalance.
Order Flow: Buy Limit Order
A buy limit order is a market order that allows one to open a buy position on price. It is plunging to a key support area or an area of order flow imbalance. It is an ideal market order for a trader who wants to decide on the minimum price they wish to open a buy position.
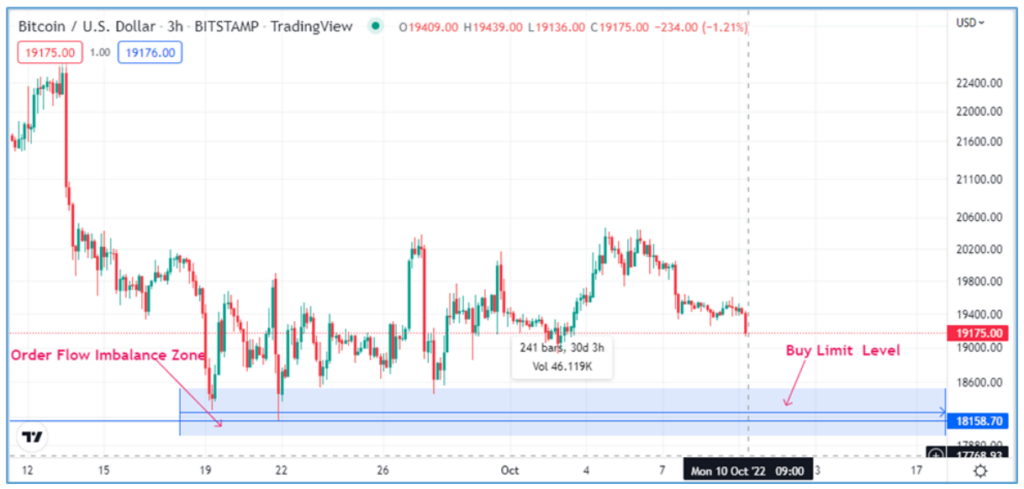
The use of the order flow indicator in the BTCUSD chart above shows price action in a range. It tends to bounce back as soon as the price tanks to the $1800 level. We can deduce that there is an influx of buy order flow at this level. Whereby buyers are increasingly placing buy positions and looking to push prices higher.
Consequently, a trader can place a buy limit order at the $18100 level. Which will trigger as soon as the price tanks to this level. The Buy limit order will allow one to go long on buyers pushing the price high above this level. A stop-loss order can also be placed a few pips below the order flow imbalance zone.
Order Flow: Sell Limit Order
The sell limit order flow order allows one to place a selling order flow that only triggers on price rising to this level. The sell limit order is placed at an area of order flow imbalance. It believed to be a level of strong resistance going by previous price action. Whereby bulls struggled to push the price higher.
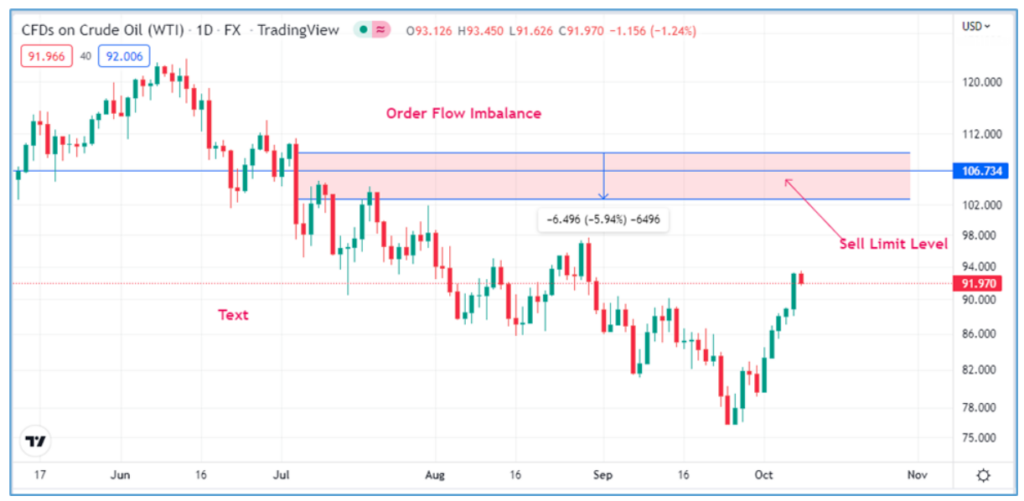
The Crude oil order flow charts above show that the $106 level is a price level with significant price action activity. Bulls have struggled to push prices high above this level in the past. Consequently, the previous order flow imbalance between buyers and sellers is an area of interest.
Given that crude oil is trending up, it is clear that the underlying trend is bearish. Consequently, the likelihood of the price getting rejected above the $106 level is high. Therefore, one can place a sell limit order in anticipation of the price reversing course and edging lower after rising to this level.
Bottom Line
Order flow chart analysis offers a reliable way of studying critical areas in order flow charts where ideal trading opportunities are likely to crop up. Therefore, analysis helps avert the risk of placing random trades. Instead, the focus is placed on areas of order flow imbalance where there is an intense tussle between buyers and people placing selling order flow.
While trading using order flow charts, it is essential to know how to detect key supply and demand areas. Or support and resistance levels. At this level, an imbalance in order flow occurs, resulting in the price moving in the opposite direction. The use of the sell and buy limit makes it easy to place trades in advance after detecting areas where the price is likely to reverse course and move in the opposite direction following an order flow imbalance.
Ready to get funded?
Check out FX2 Funding's selection of the industry's simplest, most straightforward funded account programs.
Prop trading firms can offer unique benefits for traders seeking funding for their trading endeavors. However, many traders discover that prop firms create unnecessary pressure with minimum trading day requirements. These rules can leave traders feeling rushed to prove themselves, creating a stressful trading environment that can lead to costly mistakes. No minimum trading days […]
When you’re looking for a way into trading, you might picture a lone wolf, slinging trades in a dim room lit by the glow of a computer screen. You might envision a bright office buzzing with activity, where every trade you make is met with a chorus of cheers, encouragement, or constructive feedback. If that […]
Day trading prop firms can be a game-changer for aspiring prop traders. For many traders, the biggest obstacle to achieving their goals is a lack of capital. Most day traders fail because they don't have enough money to trade. Day trading prop firms give traders access to substantial capital to help them achieve their trading […]
Let’s say you’ve been trading crypto on your own for a while. You’ve learned the ins and outs of this volatile market. You’ve developed a strategy that works for you and want to scale your trading. You want to grow your income and get better at trading. You might even want to turn trading into […]
How to become a prop trader? Becoming a prop trader is an exciting venture, especially when done remotely. However, despite the appealing nature of the industry, many aspiring traders struggle to choose a suitable prop firm to work with. 4o To make an informed decision when picking a remote prop trading firm, you must first […]
Making a living trading futures is no easy task. Most traders fail. So it’s understandable if you feel overwhelmed, even intimidated, by the prospect of prop trading. After all, prop trading isn’t just a different way to trade futures. It’s a different ball game with other rules, cultures, and objectives. Learning how to become a […]
For many traders, options can seem complicated and overwhelming. As a result, many aspiring prop traders shy away from options altogether and miss out on lucrative opportunities. How to Become a Prop Trader is a question often overlooked when navigating the complexities of options. Picking the best prop firm for options trading can help you […]
Imagine pouring hours of effort into your trading skills only to realize you've hit a wall once you feel ready to go pro. The truth is that trading is an incredibly competitive field, and most independent traders fail to make it on their own. If you’re looking for an alternative to trading alone, stock prop […]
Forex prop trading firms are valuable resources for aspiring traders. If you want to learn how to become a prop trader, you’ll quickly discover the significance of these specialized firms and what they can offer your trading journey. For instance, prop firms provide access to trading capital, which lets you skip the slow process of […]
You’ve learned the basics of trading futures. Now you’re ready to take your trading career to the next level. Prop trading firms are an exciting way to achieve that goal. With a focus on futures prop trading firms, this article addresses how to become a prop trader, the benefits of joining a prop trading firm, […]
Trading can be challenging, especially for new traders trying to figure out how to become a prop trader. You might feel overwhelmed by the sheer number of prop firms out there. How do you find the one that fits your needs? To help you on your journey, this article identifies the best prop firms for […]
Many aspiring traders dream of waking up and logging into their trading platform to begin their day. However, many traders don’t realize that achieving this success level takes time, effort, and funding. In many cases, traders improve their performance and succeed with the help of proprietary trading firms. You'll likely encounter a few proprietary trading […]
FX2 Funding, LTD (Registry #2025-00108) | The Sotheby Building, Ground Floor, Rodney Village, Rodney Bay, Gros-Islet, Saint Lucia
FX2, LLC (Registry #2694 LLC 2022) | The Financial Services Centre, Stoney Ground, Kingstown, Saint Vincent and the Grenadines
The information provided on this website is for informational and analytical purposes only and does not constitute financial, investment, tax, legal, or other professional advice. FX2 Funding, LTD does not offer, solicit, or recommend any trading or investment services. All content is provided on an “as is” basis without any warranties—express or implied—regarding its completeness, accuracy, or timeliness. Trading and investing in financial instruments carry substantial risks, including the possible loss of your principal investment. You are solely responsible for assessing the risks and benefits associated with the use of any information on this website. FX2 Funding, LTD, its officers, directors, employees, and agents shall not be liable for any damages or losses arising directly or indirectly from any decision made or action taken based on the information provided.
Disclaimer:
FX2 Funding, LTD does not offer its services to residents or citizens of the United States of America or Canada. All content on this website is intended for audiences in jurisdictions where FX2 Funding, LTD is legally permitted to operate. By accessing this website, you confirm that you are not located in, or a citizen or resident of, any jurisdiction where our services are restricted or prohibited.