These are the most popular continuation trading patterns that every trader should know. Check out various continuation patterns and read about bullish and bearish continuation candlestick patterns.
Candlestick charts are a benchmark of Forex trading, one that you must familiarize yourself with to make informed decisions. Continuation patterns occur over some time to indicate asset price movements, market pressures, and volatility.
By displaying how an asset’s price moves, candlestick bars and charts relay that information to FX traders as technical analysis. A trader can decrypt fluctuations by reading a few patterns and recognizing significant resistance and support levels.
Why Should You Use Candlestick Patterns When Trading?
To correctly read the market landscape and asset price movements, a trader relies on candlestick bars, which form charts and patterns. It’s one of the easiest ways to plot the prices of equities, recognize trends, and predict the market’s direction.
Candlesticks forex charts illustrate price changes over time utilizing candlestick patterns, which help traders analyse sentiment in the markets and make informed choices regarding trading.
Unlike other indicators, namely area, figure, line, and point, candlesticks tell a lot more about aspects of the trend, such as opening and closing prices. Above all, with candlestick charts, you’ll gain valuable market psychology insights, especially on investor and trader behavior.
You’ll achieve a profitable edge once you understand the market’s psychology and that of its participants, which improves your entries and exits.
Contrary to what you may think, candlestick patterns aren’t a modern trading innovation, though, as they’re thought to have originated in Japan. A rice trader named Munehisa Homma became very wealthy using candlestick patterns in the 1700s.
Steve Nison, the author of ‘Japanese Candlestick Charting Techniques, 1991,’ is credited with introducing the technical analysis method to the west.

Source: https://www.ig.com/en/trading-strategies/japanese-candlestick-trading-guide-200615
How Are Candlestick Patterns Read?
For an understanding of candlestick patterns, evaluate the shape, dimension, and placement of the distinct candles.
Forex candlestick indicators are indicators that display candlestick patterns straight on price graphs, allowing real-time research of market actions.
One of the advantages of using candlestick patterns as opposed to other technical analysis measures is that they show you more than an asset’s opening and closing prices.
Besides doji, dragonfly, and gravestone bars, candlesticks bars are rectangular. With the color green indicating bullish bars while red is bearish.
You can also read the high and low status of a price opening and closing by the line sticking out. Each end of the candlestick is known as a wick or shadow. These horizontal lines stick out at each of the bar’s top and bottom sections, except in the case of Marabozu or shaven head candlesticks.
While it’s essential to know the names of different types of candlesticks, you can benefit your trading results by learning the significance of various candlestick charts:
- The top of the body represents the opening price on bearish bars, while the bottom denotes the same on a bullish candlestick. It’s also true for the closing price, which is reflected by the bar’s top part in bullish candlesticks and the bottom in bearish ones.
- The bar’s top wick denotes the highest trading price for the asset in any given session. While the bottom reflects the lowest price traded.
- A candle’s location and color will indicate the price direction and the distance between the highest and lowest price. Thus showing that asset’s sessional price range.
Rules to Follow Using Candlesticks
When using candlestick patterns in forex trading, following certain guidelines can help you make more informed decisions and boost your trading results. To get started, never act on a candlestick pattern indicator without first receiving confirmation. Other candlestick patterns, technical indicators, or price fluctuation signals might all serve as confirmation.
Secondly, examine the pattern’s perspective within the wider trend. The significance of a candlestick pattern increases when it correlates with the current trend direction. A candlestick bullish pattern, for instance, has more significance in an uptrend, but the negative reversal patterns have a greater impact in a decline.
Thirdly, establish take-profit and stop-loss levels and implement appropriate risk management strategies. Whereas, if we delve into the question of how to read Japanese candlesticks, evading Japanese candlesticks entails analysing the open, high, low, and closing prices of each candle in order to assess market sentiment along with potential price direction.
Further, raise patience and discipline. The candlestick method investigates price fluctuations on charts using candlestick patterns, allowing traders to identify market sentiment and make better-informed choices while trading. Candlestick continuation patterns indicate immediate interruptions in current market trends before they restore their original route, which helps traders discover suitable entry chances for trend-following techniques.
Reversal candlestick patterns, which include the hammer, shooting star, evening star, and morning star, suggest future market shifts. Traders employ these patterns to forecast trend reversals and customize their positions correspondingly.
What is a Continuation Pattern?
A continuation pattern signifies that, adhering to a brief period of stabilization or halt, a continuing trend is expected to continue. Forex continuation patterns, including flags, pennants, and triangles, represent brief halts in current trends, permitting traders to make money.
An individual candlestick bar makes a chart which ultimately results in a pattern in which a trader leverages insight into market selling and buying pressures along with any indecision. Forex traders are naturally inclined to spot price reversals. So they’ll ride a trend further, and skill in using continuation candlesticks comes in handy.
A continuation candlestick pattern is recognizable as it shows a continual current price trend. And you’ll notice attributes such as when an asset skips a price point. These gaps in prices can gap up or down by skipping points forward or downward. Essentially indicating areas of support or resistance.
You must recognize and spot gaps caused by selling and buying interests during market closing hours, over weekends, and after important news events. As such, a gap candlestick pattern indicates the direction of the market plus the sentiments of investors and traders regarding the open-close prices of an asset.
Continuation, one type of gap among others like breakaway and exhaustion. Shows that the price skip occurred in the middle of the trend and closed within two days. In essence, these gaps happen while the asset price is on an uptrend, but only for assets that don’t trend for months.
Source: https://forexbee.co/bearish-continuation-candlestick-patterns/
What Are the Top Continuation Candlestick Patterns?
The continuation candlestick pattern signals a prevailing trend once the breakout is confirmed and after a temporary trading pause in the market. It’s the opposite of price reversal points, as they indicate the likelihood of trends continuing in the same, higher direction.
Buyers control the price action as long as an uptrend happens. And bullish continuation candlestick patterns will show a series of higher highs and higher lows. For instance, you can continue holding your position when bullish continuation patterns occur above the market price.
Triangles, Pennants, and Bearish and Bullish Flags are the most famous continuation candlestick patterns. Variety in continuation candlestick patterns means different gaps or market pauses from which to read sideways market movement. You can determine whether the pause in market activity or a short-term trend will resume in its current direction, allowing you to ride it further.
Types of Continuation Candlestick Patterns
Bull and Bear Flags, Pennant designs, Triangles, and Rectangles are a few examples of continuation candlestick patterns.
These trends indicate that which trend is taking some sort of break before continuing in its original path.
Gaps
When there is an apparent variance between the closing price of the day prior and the opening price of the following day, usually there are trading gaps. They frequently indicate important changes in the mood of the market or breaking news.
While a bearish gap is this configuration but the other way round, there are several types of gap candlestick patterns.
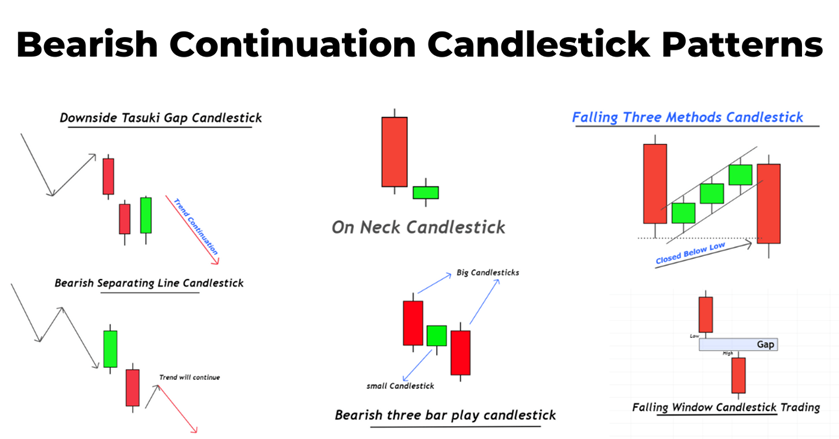
The Tasuki Gap
Known as the upside Tasuki gap, it’s a bullish continuation candlestick pattern made up of three bars, with the third bar partially closing the gap. The second candlestick opening is higher than the first one’s closing, and the third opens lower than the second’s closing.
While the third candlestick in a Tasuki gap continuation falls short of closing the gap, the two wicks before the first bar represent the previous trend’s price range. The gap is bullish because it signals an uptrend despite the color change from green to red on the last bar.
Besides signaling the asset’s uptrend nature, another psychology behind this continuation candlestick pattern is that the bears step in. That’s when a downside Tasuki gap happens after bulls have been in firm price point control. The bulls, however, return in force after the third candlestick price pushdown. And the market closes higher than its lowest point.

Source: https://forexbee.co/downside-tasuki-gap-candlestick-pattern/
Gapping Play
A gapping play is a method of trading that takes advantage of price gaps between the final and initial prices of successive trading sessions in order to profit from short-term market changes.
A gapping pattern involves a large-bodied candlestick followed by two or three small-bodied candles. Whether high in an uptrend or low in a downtrend, the last candlestick is another long-bodied bar in that same direction after a gap.
Side By Side White Lines
The side-by-side white lines gap continuation pattern features a similar 3-candle arrangement as the upside Tasuki gap, but the third candlestick follows the direction of the last two. All the bars in this technical analyzer are green, signifying the bulls control the asset’s price points.
Two white lines before the side-by-side continuation pattern reflect the price range on that uptrend. The psychology behind the third candlestick gapping up slightly is that bears have stepped in to test the bull’s strength, but they weren’t ready to relinquish price point control.
Three White Soldiers and Three Black Crows
An easy-to-spot pattern features three short wicked candles in a row, and the 3 white soldiers are bullish while the black crows are bearish. The three white soldiers pattern is interpreted to mean the trend has strong momentum and is likely to continue, despite showing signs of exhaustion.
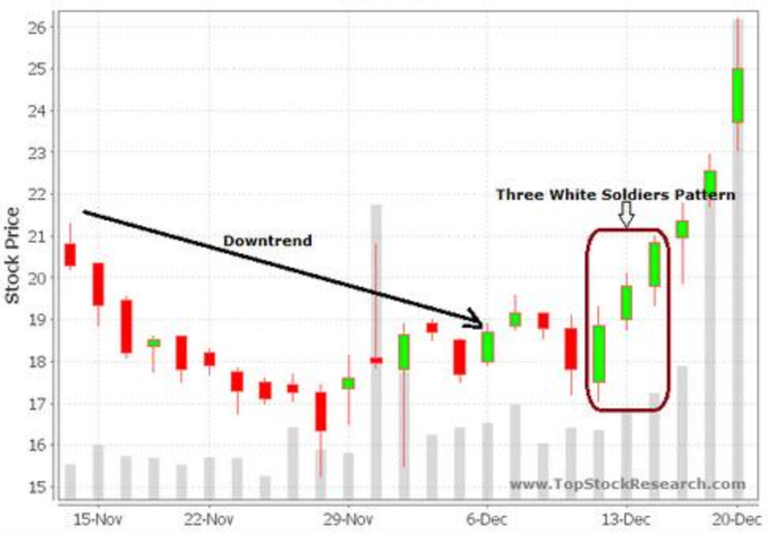
Source: https://www.adigitalblogger.com/chart-patterns/three-white-soldiers/
Three soldiers’ pattern is also called the three-line strike. A bullish gap that appears when the second candle’s opening is higher than the previous candle’s closing. However, its low doesn’t reach the level of the first candlestick.
The Rising Three and Falling Three Method
The Rising Three Method is a bullish continuation pattern composed of three small-bodied candles falling inside the price range of a large bullish candle. Alternatively, the Falling Three Method is a bearish continuation pattern.
Separating Lines Pattern
Separating lines patterns features a first candlestick opening against a prevailing trend, while another candle opens at the first’s price. It is also called the Thrusting Line method with variations, such as reversal and continuation candlestick patterns create an internal gap. And two lines before the bars represent the asset’s price range.
Pros and Cons of Continuation Candlestick Patterns
Continuation candlestick patterns offer multiple benefits in forex trading. First and foremost, they specialize at recognizing probable trend continuations, enabling traders to capitalize on the current market momentum. Their straightforward nature makes them approachable to even inexperienced traders, while still offering a clear visual picture of market sentiments. Furthermore, these patterns are adaptable across multiple time structures, permitting traders to use them in a variety of trading methods.
But there are also some disadvantages that must be taken into consideration. The possibility of incorrect signals is one of the key problems. Sometimes, continuation patterns may point to a trend continuation when the stock market truly is about to turn, which could result in damages if not appropriately identified. The simplest trading strategy based on employing continuing candlestick patterns include spotting patterns such as the bullish/bearish engulfing, harami, or three white soldiers/black crows.
Additionally, while continuation candlestick patterns offer useful information, they should not be solely relied upon as standalone signals. Integrating them into a comprehensive trading plan, alongside other technical analysis tools, enhances their effectiveness. This integration helps traders in filtering out spurious signals and increasing decision-making precision.
Moreover, the demand for verification introduces a subjective and interpretive component that can be difficult, particularly for new traders. It requires a thorough comprehension of market mechanics, as well as the ability to distinguish between genuine and false signals.
Candlestick forex patterns offer visual explanations for market state and price movements, which help traders spot impending trend reversals. Forex candlestick patterns help traders analyse sentimental markets and predict future swings in prices based on past data.
Bottom Line
In short, continuation candlestick patterns provide multiple advantages in forex trading. These patterns are adaptable and easy to use for beginner traders.
You’ll often use candlestick patterns alongside technical analyzers like moving averages to support your buying or selling decisions. Continuation candlesticks patterns will help you identify the gaps in the market on which you can read the price movement and indecision on neutral.
After robust directional moves, a gap or continuation candlestick pattern may indicate the acceleration of a trend. While not prone to false signals, trends often last longer and offer buy or sell opportunities than reverse patterns.