Trading should not be as complicated as most people make it look or appear. Staying simple in the analysis and execution of trades is sometimes enough. Instead of using dozens of indicators or automated trading tools, one can still generate substantial profits by relying on simple trading strategies. A simple trading strategy that always stands out for novice and professional traders entails mastering and taking advantage of price action around horizontal levels: support and resistance.
Mastering Horizontal Levels
The simple trading strategy way to trade any security in the financial markets is to understand how to identify support and resistance levels. These are levels where ideal trading opportunities often crop up. But, unfortunately, it is also at this level that traders usually exit the market if they are already in a trade.
Horizontal Support Level
It refers to the lowest level where the price struggles to move below a significant move lower. If you pay close attention to price action, you will identify levels where the price failed to dip below and ended up bouncing back, reversing course, and moving up.
The support level provides ideal areas to enter long positions as it acts as a magnet for attracting buyers into the market. Consequently, any simple price action strategy should pay close attention to the support level.
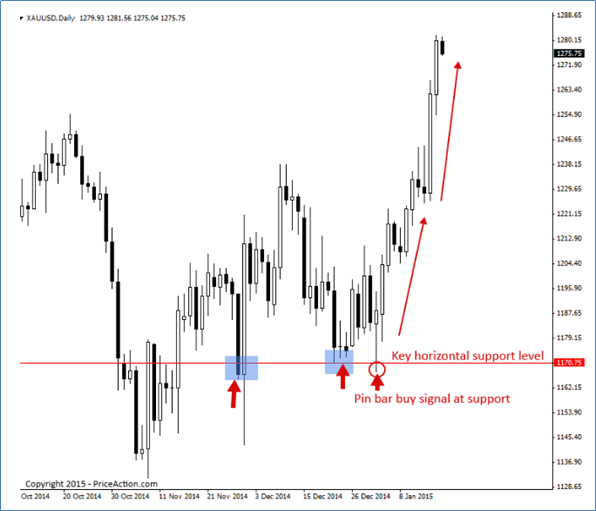
Source: Priceaction.com
The chart above shows a gold price action. After the price had moved lower, it bounced back and started moving up. However, sellers came into the fold and tried to push prices down. After pushing the price lower, they struggled to engineer another leg lower as buyers came into the fold and pushed the price up.
The first arrow indicates a crucial area of the battle between sellers and buyers. It is at this level that support was first marked. Later on, sellers came into the fold and tried to push prices lower. However, near the 117 level, buyers flocked to the market and pushed prices up.
Sellers struggling to lower prices the second time only affirmed the 117 area as a crucial support level. Likewise, as depicted by the third arrow, the emergence of a pin bar signal at the support level only affirmed the support level.
From the chart above, it is clear that price action failure to push below the support level affirms the prospect of price pushing up. Consequently, traders often look out for buy positions at the support level as the price usually bounces and moves up.
Support levels tend to occur at the lowest price action level and charts. The formation of a large bullish candlestick at the support level acts as a buy signal signaling buyers have overpowered sellers and that price is likely to move up.
Horizontal Resistance Level
Resistance in price action refers to a level where the price struggles to move up, as was the case in the past. The level mainly occurs at the top of price charts, whereby buyers fail to push prices higher. Every time the price rises to this level, it experiences a strong selloff, resulting in the price moving lower.
By looking at the price chart of any security, it becomes easy to see levels where the price rose but came under pressure and moved lower more than two times from the same level. An easy price action strategy should pay close watch to the resistance level for potential price breakouts or rejections.
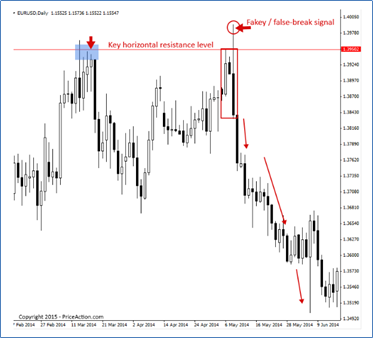
Source: Priceaction.com
The chart above clearly shows that the price was trying to move up in the first phase. However, as depicted by the first arrow at the 1.39 level, it came under pressure and ended up moving lower. The fact that the price got rejected at this level affirms why it is an area of interest and a potential resistance level.
After the price had moved lower, it bounced back and yet again tried to move above the 1.39 level. While it broke through the 1.39, its failure to close above the level affirmed strong resistance to buyers’ bids to push the price higher.
The formation of a strong bearish candlestick below the 1.39 level firmed the resistance level. From the resistance level, it is clear that the price edged lower.
Trading Range-Bound Markets
In range-bound markets, prices fall when they try to move above a given level (resistance level). And also struggle to move below the support level’. In this case, the price tends to oscillate within the level, moving up and down without making any new highs or lows.
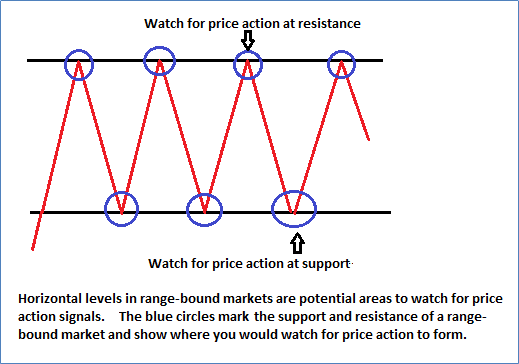
Source: learntotradethemarket.com
In the chart above, it’s clear that the price dropped as soon as it rose to the resistance level as sellers flocked to the market and pushed the price lower. Additionally, the price bounces back at the support level and moves up, collapsing to the support level.
Simple Trading Strategy Bottom Line
The simplest trading strategy focuses on the horizontal support and resistance level. These are high-probability areas where ideal trading opportunities in trending markets emerge. Whenever a large candlestick occurs at the support and resistance levels. It provides a reliable signal on the direction price is likely to move.
For instance, the emergence of a large bullish candlestick. At the support level affirms price is likely to move up on a buildup in buying pressure. Similarly, the emergence of a large bearish candlestick at the resistance level signals price is expected to move lower as selling pressure builds up.