Market swings are some of the most sought-after as they provide the best trading opportunities for swing traders. Swings appear as small price movements within larger trends. Therefore, swing trading is one of the most important and effective trading styles that allow traders to take advantage of small price movements in the market. Swing trading is less intimidating as traders don’t have to spend hours glued to the screen opening and closing positions. Instead, traders can take advantage of price fluctuations and let trades run for days or weeks.
Technical traders rely on indicators to identify potential swings. The indicators allow traders to identify support and resistance levels whereby the price will likely break out or reverse direction from the underlying trend.
How Swing Trading Works
In swing trading, traders look to open a position in a given direction and let the position accrue profits until a reversal occurs. The position will only be closed when the trend shows signs of reversing. Unlike day trading, traders are not interested in short-term price volatility. Consequently, the focus is on price actions in larger time frames.
Swing Highs and lows are the only things that matter in swing trading.
Swing Highs: In this case, the price tends to make new peaks after every pullback. Whenever the price moves up and forms a new swing high from the previous correction, it affirms a bullish trend, signaling it is the best time to look for buy or long positions.
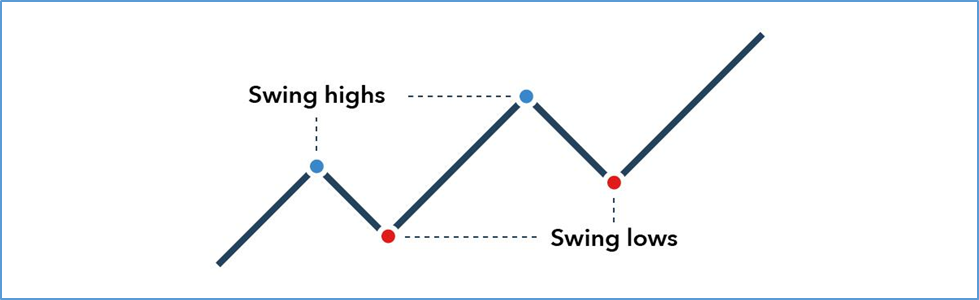
Source: IG.com
Swing lows: They are mainly used to affirm a bearish trend implying it is the best time to look for short or sell positions. Swing lows occur whenever the current low is lower than the previous low, signaling a buildup in selling pressure.
What Are Swing Trading Indicators?
Swim trading indicators are technical analysis tools allowing traders to determine whether the market is bullish or bearish. Additionally, the tools can affirm the strength of the prevailing momentum, making it easy to know whether the trend will hold or reverse.
The top indicators for swing trading are broadly classified into three categories:
- Trend Indicators
- Momentum Indicators
- Volume Indicators
Trend Indicators
These are technical indicators for swing trading that signal the direction in which the market is moving. In this case, they signal whether the market is moving up or down. The indicators smooth price volatility to confirm the primary trend. The best indicators for swing trading based on trend include the moving averages and Moving Average Convergence Divergence.
Momentum Indicators
These swing trading indicators show the solid underlying trend and whether a reversal could be in the offing. Additionally, such indicators confirm whether the underlying asset is sold too much, thus oversold conditions, or bought too much, thus overbought conditions.
Volume Indicators
They are some of the best forex indicators for swing trading, showing how many traders buy or sell at any time.
Below are some of the best indicators for swing trading based on the above classification.
Moving Average
Moving Average is a common indicator used in many swing trading strategies. It stands out as it allows swing traders to calculate or know the average price of an underlying asset at a given time. While MAs are lagging indicators that rely on past price actions, they are mainly used to confirm the underlying trend rather than predict future price movements.
MAs are classified into three; short, medium, and long-term MAs. The classification is based on how many periods the indicator monitors. Short-term moving averages have a period of between 5 and 50, while medium-term MAs have a period of between 50 and 100. Long-term MAs have a period of more than 100.
Moving Average Swing Trading Strategy
The most popular swing trading strategies leveraging moving average indicators rely on short and medium-term MAs. In this case, one can use a 21 Moving Average as the short-term MA and 100MA as the long-term MA.
The strategy is based on the crossovers that come into play. Consequently, whenever the short-term 21MA crosses the 100MA and starts moving up, it affirms the start of an uptrend. The crossover signals a buildup in bullish momentum, implying that prices will likely increase.
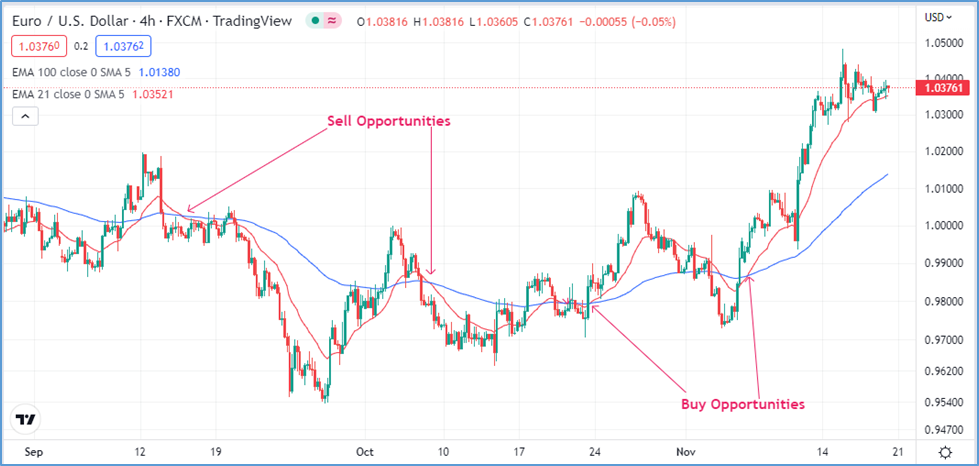
Source: Tradingview.com
Consequently, a swing trader can use the opportunity to open a buy position in anticipation of accruing profits as the price moves up the chart. The traders will let the position remain open or run until the 21MA crosses the 100MA and start moving lower, implying a change in momentum from bullish to bearish.
Likewise, the trader can look to open short positions whenever the 21MA crosses the 100MA and starts moving lower. The crossover implies the start of a downtrend presenting an opportunity to profit from short positions as the price edges lower. The trader will let the position run until the 21MA crosses the 100MA and start moving up, suggesting the end of the downtrend and the start of an uptrend.
Relative Strength Index
It stands out as one of the best swing trading tools on its ability to confirm the prevailing market momentum. The indicator calculates the sizes and magnitude of the latest price changes, showing which traders have the upper hand: bulls or bears. In addition, it comes with readings of between 0 and 100, which helps affirm overbought and oversold conditions.
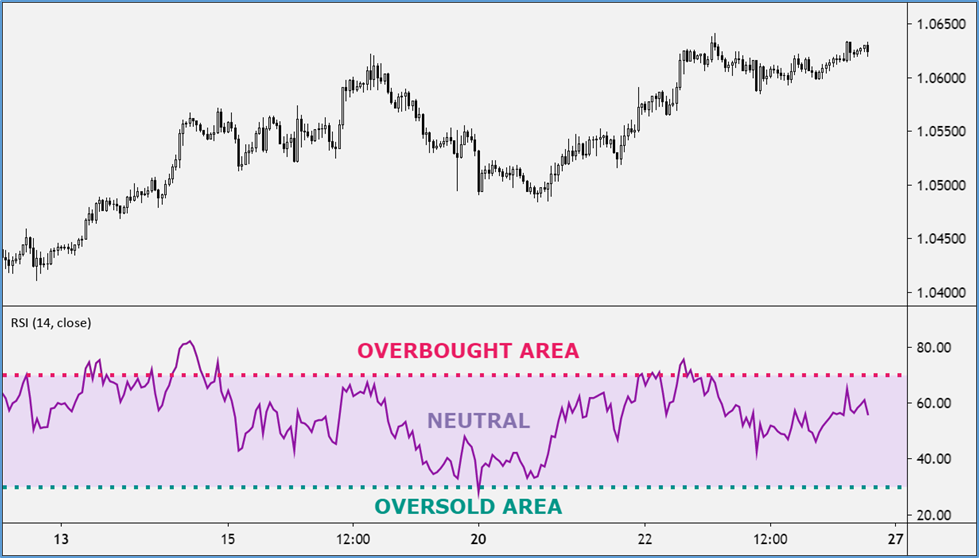
Source: Babypips.com
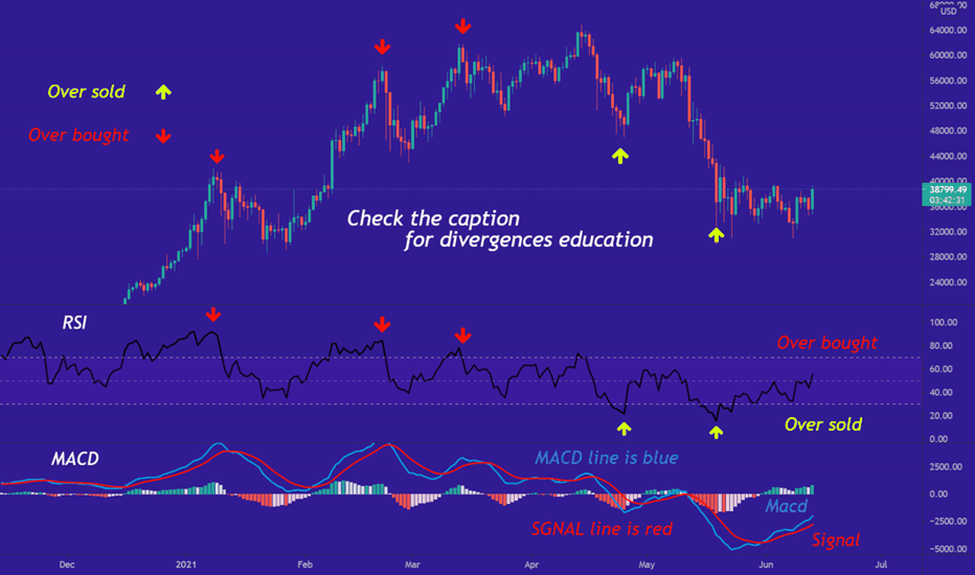
As the oscillator moves between the extremes of 0 and 100, it signals the prevailing market conditions, whether bullish or bearish. Consequently, whenever the oscillator reading is above 50, it signals bullish momentum implying traders should look out for long positions as more buyers are placing positions.
On the other hand, whenever the RSI reading is above 70, it signals the underlying asset has been bought too much, thus the overbought conditions. While the price can continue increasing even with the RSI reading above 70, the prospect of a price reversal occurring at this level is usually high. Therefore, swing traders generally look for reversals whenever the RSI exceeds 70.
Likewise, whenever the RSI reading is below 50, it implies a buildup in bearish momentum, suggesting swing traders should look to enter sell or short positions. Whenever the RSI is below 30, it suggests the underlying asset is sold too much and thus oversold. While sellers can continue pushing prices lower even with the oversold conditions, price reversals tend to occur at these levels.
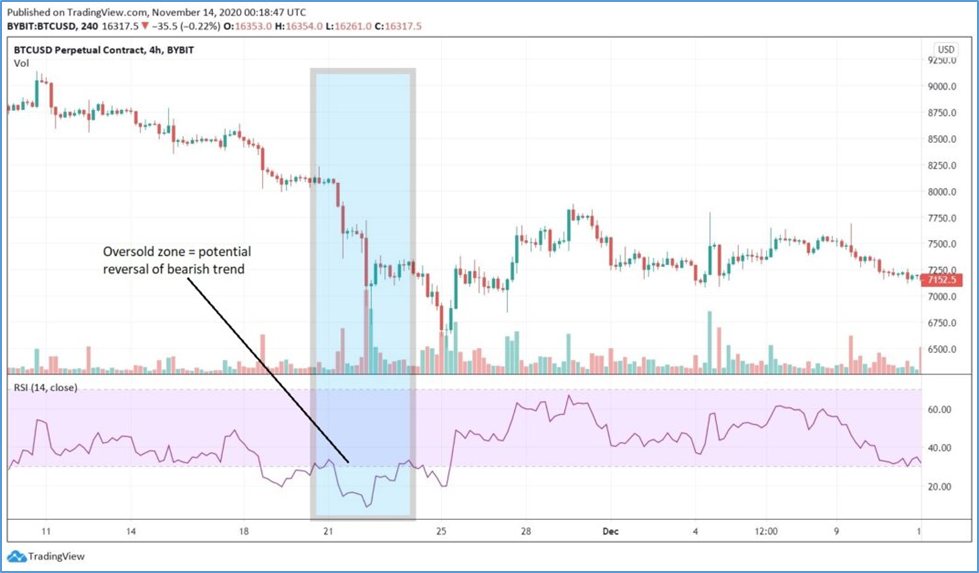
Source: Bybit.com
The price chart above shows that the price is in a downtrend in the initial phase as soon as the RSI falls below 50. As the price dropped significantly, the RSI dropped below 30 and fell below 20. While the price did move lower significantly, the downward momentum lost strength as swing traders sensed the oversold conditions. The price returned as the RSI rose above 30 from the oversold condition.
The bounce back in the RSI presented an opportunity to enter a buy position to profit from a potential bounce back from oversold conditions.
Volume
Volume is one of the best indicators for swing trading as it allows swing traders to align their positions with the direction in which big players are trading. The indicator is typically set below the main chart by default and shows how robust a new trend is. While the indicator shows how many traders buy or sell a given asset, it emerges as bars below the price chart.
The bigger the bars, the higher the trading volume, implying traders will likely push the price toward their orders. As the bars increase, more buyers or sellers are placing orders toward the underlying trend.
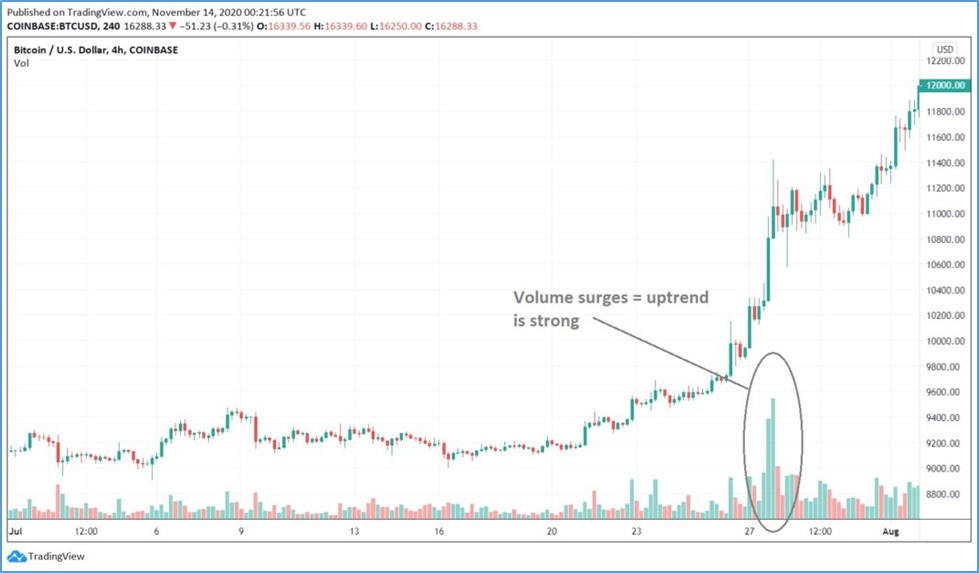
Source: Bybit.com
The price chart above clearly shows that Bitcoin increased as volume surged. This is because swing traders could have used the opportunity to enter a long position and align their positions with whales pushing prices higher as the volume bars increased.
Whenever the volume bars appear small and balanced, it implies consolidation, signaling that neither buyers nor sellers are in control. In this case, the price is expected to move in a range and struggle to make any new highs or lows.
Moving Average Convergence Divergence Indicator
The moving average Convergence Divergence indicator is one of the best forex indicators for swing trading as it shows the trend and underlying momentum of the asset under study. The indicator comes with two moving averages, a fast-moving and a slow-moving. In addition, it comes with a Histogram that shows the strength of the underlying trend.
The fast-moving average acts as the MACD line as it responds fast to price action activity in the market. On the other hand, the signal line is the slow-moving average that takes some time before changing direction.
Source: Tradingview.com
Consequently, whence the MACD line moves above the Signal line, it implies a buildup in buying momentum, implying the start of an uptrend. Traders can use the opportunity to enter long positions in anticipation of higher prices.
As the buying pressure increases, the MACD line will move further away from the Signal line. As a result, the Histogram will appear above the zero line and increase in size as the upward momentum increases.
On the other hand, whenever the MACD line or the fast-moving average crosses below the Signal line and moves lower, it implies a buildup in selling pressure. Swing traders can use the opportunity to open short positions.
As the selling pressure increases, the MACD line will move further away from the Signal line. As the Histogram increases in size below the zero line, it signals the appropriate time to eye short-selling positions.
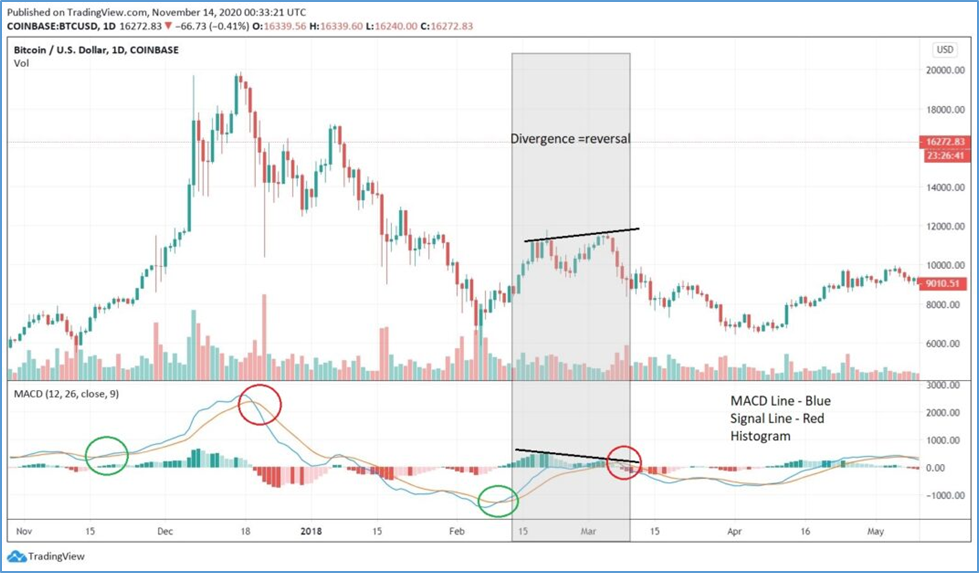
Divergence is another scenario swing traders pay close attention to when looking to profit from potential price reversals. Whenever the MACD line is above the Signal line, the price is expected to continue increasing, making higher highs. However, that is only sometimes the case.
Source: Bybit.com
Identifying Divergence Signals for Swing Trading
There comes a time when the price makes new higher highs, but the MACD indicator changes course and moves lower instead of also making higher highs. As the MACD indicator makes lower lows while the price makes higher highs, it affirms a disconnection or divergence.
If this were to happen, swing traders would look to enter short positions as the prospect of price reversing from the higher highs is usually high. The MACD making lower lows signals bearish momentum is slowly building up and that price is unlikely to edge higher further.
Likewise, it implies divergence whenever the price moves lower, making lower lows while the MACD indicator increases. A swing trader can look to enter a buy position as the MACD indicator implies. That buying pressure is building up and that price will likely bottom out from the downtrend and move up.
Bottom Line
The best indicators for swing trading are the ones that provide valuable insight into the underlying trend, the momentum, and the direction in which most traders are placing positions. Moving Average, RSI Volume, and MACD are some of the best swing trading tools in this case.