In the complicated world of trading, the Wyckoff method stands as a beacon of clarity. Developed by Richard D. Wyckoff, this methodology provides traders with a systematic framework for evaluating market dynamics. Join us as we explore the complexities of Wyckoff’s technique in the comprehensive step-by-step explanation in this article.
Understanding the Wyckoff Method
Recognizing the Wyckoff Method means getting into the principles and strategies created by Richard D. Wyckoff to analyze market dynamics and make sound trading decisions. At its foundation, the technique focuses on the interaction of price, volume, and market sentiment to detect accumulation and distribution stages.
Traders learn how to forecast future price movements by understanding Wyckoff chart, volume analysis, and the acts of the “Composite Man”. By mastering Wyckoff’s ideas, traders gain a better grasp of market psychology and create a methodical approach to trading, allowing them to navigate the complexities of financial markets with comfort and accuracy.
The Wyckoff Method’s “Composite Man” illustrates the collective force driving market movements, reflecting the acts of institutional investors and significant traders. Understanding the Composite Man is critical as it reveals the fundamental causes driving price action. The Wyckoff Pattern is a type of technical analysis chart pattern designed to recognize probable buying and selling possibilities within financial markets. Richard Wyckoff invented the Wyckoff Method, which depends on the assumption that significant financial institutions and experts will determine prices in the market.
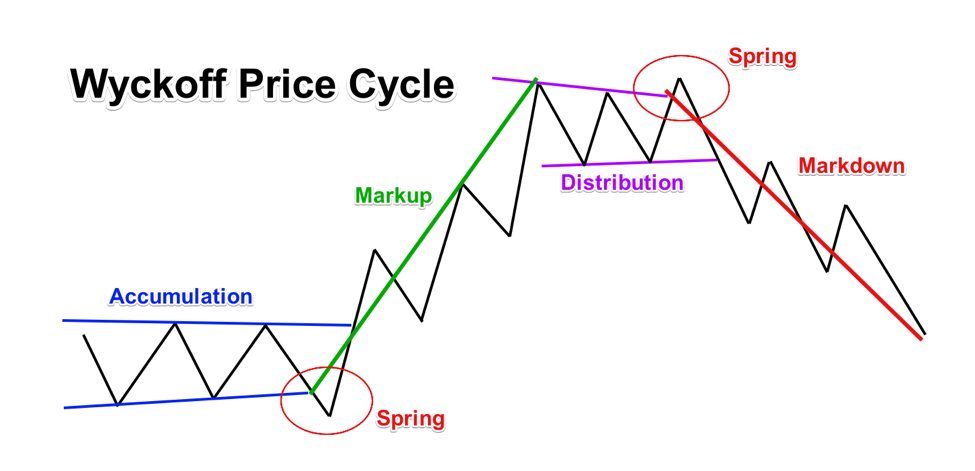
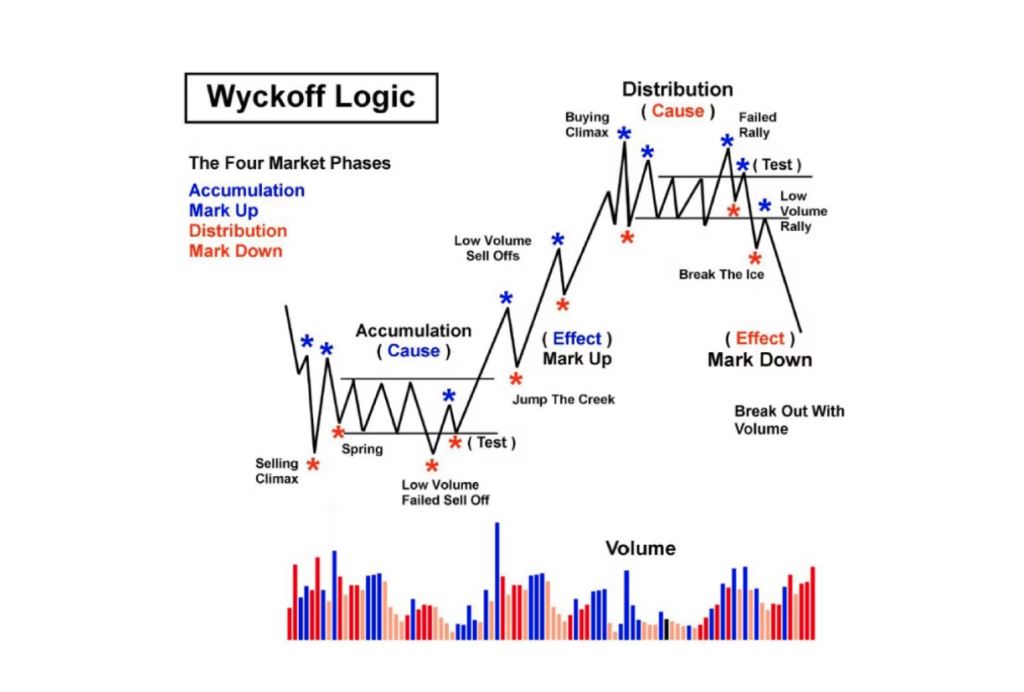
The Wyckoff market cycle is divided into four parts: accumulation, markup, distribution, and markdown, which correlate to the various stages of client activity and market sentiment. Analyzing these phases permits traders and investors to apply the Wyckoff Pattern to make more informed choices regarding investments.
Accumulation Phase
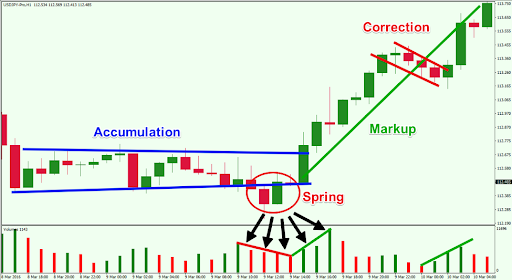
The Wyckoff accumulation phase is an essential moment in market dynamics during which institutional investors and smart money operators secretly accumulate shares at beneficial prices prior to a massive rise. This phase usually follows a prolonged downturn or consolidation period.
During accumulation, market fluctuations may appear range-bound or with little upward momentum as purchasing pressure gradually exceeds selling pressure. Volume analysis is critical in spotting accumulation, since increased volume during price consolidations indicates accumulation by powerful hands.
Traders that use the Wyckoff Method look for crucial accumulation includes such as price stability, reduced downside volatility, and indicators of selling pressure absorption. Breakouts from accumulation zones frequently mark the start of a new uptrend, providing lucrative trading possibilities for those who spot the accumulation phase early. Breakout trading entails detecting points where the cost of an asset breaks through an essential level, indicating prospective trends, and then generating trade choices based on these fluctuations.
Mark Up Phase
In the Wyckoff Method, the mark-up phase occurs after the accumulation phase and symbolizes an instance when the market experiences a significant upward movement due to substantial buying pressure from institutional investors and smart money operators. At this phase, prices rise quickly as supply cannot keep up with demand, leading to significant price increases.
The mark-up phase is characterized by constant upward price movement, which is accompanied by rising volume, indicating greater buying activity. As a beginner trader, while trading Wyckoff you must look for key features of the mark-up phase, such as ongoing upward trends, frequent higher highs and higher lows, and expanding trading ranges. Breakouts from consolidation patterns or resistance levels frequently signal the continuation of the mark-up period, giving traders a chance to enter long positions.
By recognizing and capitalizing on the mark-up phase, traders can ride the market’s momentum, maximizing profit potential while correctly restricting risk. Mastering the features of the mark-up phase allows traders to navigate bullish market situations with confidence and precision, thereby boosting trading success.
The Distribution Phase
The Wyckoff distribution phase occurs after the mark-up phase, and is an important time in market dynamics when institutional investors and smart money operators start to sell their holdings to less experienced market players.
As selling pressure eventually exceeds purchasing pressure, prices may appear range-bound or show a modest downward trend during this phase. Volume analysis is essential for distribution identification, since increasing volume during price rallies indicates strong hands are sharing the assets.
Traders pay close attention to recognizing significant traits of the distribution phase, like price volatility, a trend of lower highs and lower lows, and indications that purchasing demand is being overwhelmed by selling pressure. Breakdowns from support levels or consolidation patterns often indicate that the distribution phase is still ongoing, indicating the possibility of adverse momentum and providing traders with chances to reduce their long positions or take profits.
The Markdown Phase
According to the Wyckoff Method, the markdown phase begins after the distribution phase and implies a significant fall in prices as selling pressure rises and the market declines. Prices tend to decrease swiftly but steadily during this stage as selling outpaces buying activity. Consistent downward price momentum and rising volume, which point to increased selling activity, are characteristics of the markdown period.
Traders focuses on detecting the crucial components of the markdown phase, which include consistent downward trends, a regular occurrence of lower highs and lows, and an expansion of trading ranges to the downwards. The ongoing operation of the markdown phase can often be confirmed by breaks from support levels or consolidation patterns, which gives traders the chance to liquidate long positions or enter short positions.
Bullish and bearish flags are chart patterns that signify probable price breaks within an uptrend (bullish) or downtrend (bearish), enabling traders with information regarding possible future market positions.
Why the Wyckoff Model Works
The fundamental grasp of supply and demand dynamics, market psychology, and frequent trends in price swings which underlies the Wyckoff Method’s efficiency. Through the examination of these components, traders are able to make well-informed trading decisions by gaining understanding of the attitudes and actions of market players.
The concept of a supply and demand imbalance, in which changes in the market result in changes in price direction, is central to the Wyckoff method. By being aware of this imbalance, traders may identify the best times to enter and leave a trend and predict trend reversals.
Stop loss orders act as protection mechanisms for your investments, permanently liquidating your assets if their value falls below a specified threshold, reducing potential losses and protecting your portfolio from extreme downturns.
The Wyckoff Market Cycle depends on the theory that major institutional investors and executives stimulate market activity within the accumulation phase. Mastering it enables investors as well as traders to more effectively forecast market movements in order to make apprised choices regarding investments.
chickyrun demoPros and Cons of the Wyckoff Trading Method
The Wyckoff trading system has multiple pros and cons that traders should assess.
Some basic pros of the Wyckoff Trading Method are:
- One of the Wyckoff Method’s primary advantages is its ability to identify probable market turning points. By monitoring supply and demand dynamics and examining price-volume linkages, traders can anticipate market sentiment shifts and position themselves ahead of large price movements.
- Unlike common technical indicators, the Wyckoff Method emphasizes comprehending market behavior and the behaviors of significant market participants. This focus enables traders to acquire insight into the basic factors affecting price actions, resulting in better informed trading decisions.
- The Wyckoff Method’s principles apply across time frames and marketplaces, making it beneficial to traders using a variety of financial instruments and trading techniques. Whether trading equities, FX, or cryptocurrency, traders may modify Wyckoff’s concepts to their needs.
Whereas some basic cons of the Wyckoff Trading Method are:
- The Wyckoff Method is complex and difficult to learn, necessitating a thorough understanding of market psychology and technical analysis principles. To correctly interpret Wyckoff accumulation patterns, traders might have to invest a large amount of time and effort.
- To successfully utilize the Wyckoff Method, you must have previous expertise in reading price action and volume patterns. Novice traders may struggle to correctly detect and interpret Wyckoff patterns, resulting in potential losses.
- The Wyckoff Method, like all other trading techniques, is prone to misleading signals. Traders must remain careful and employ other confirmation procedures to filter out invalid signals, and avoid trading exclusively on Wyckoff analysis.
Volume Spread Analysis
Volume Spread Analysis (VSA) is a powerful analytical method that usually works together with the Wyckoff Method to enhance market analysis. VSA analyses the link between price fluctuations and volume, providing helpful insights into market dynamics. In the framework of the Wyckoff Method, VSA assists traders in determining the intentions of smart money operators and institutional investors by analysing how volume varies during price swings.
By integrating VSA with Wyckoff analysis, traders can better identify accumulation or distribution stages, as well as assess the strength of trends and probable reversals. For example, increased volume with price increases indicates high buying demand, which supports the principles of Wyckoff accumulation.
On the other hand, increased volume during price reductions may suggest distribution. Traders can make better judgments by combining Wyckoff’s concepts with VSA, allowing them to find optimal entry and exit possibilities, minimize risk, and improve overall trading performance in a variety of markets and time periods.
How to Profit from the Wyckoff Forex Strategy
Profiting from the Wyckoff Forex Strategy involves implementing its fundamental ideas to currency markets. First, traders check forex charts for Wyckoff accumulation and Wyckoff distribution phases, which imply potential buying or selling opportunities. Traders can better predict future price changes if they recognize these patterns and understand the market attitude. After that, traders employ volume analysis to confirm the reality of price swings. Increasing volume during price rises or drops can validate trend strength and provide confirmation for Wyckoff analysis-based trading suggestions.
Furthermore, traders use risk management strategies to preserve their capital and enhance profits. This involves placing stop-loss orders to limit potential losses and using correct position sizing to effectively control risk. Furthermore, traders may use different time frames to align their trading decisions with larger market trends and increase their chances of success.
The Wyckoff Forex strategy enables traders to earn money from currency trading through the combination of Wyckoff’s concepts with discipline, risk management, and strategic study of forex markets.
Wyckoff Trade Entry: Buy Position
In the Wyckoff Method, grabbing a purchase position involves recognizing times that are ideal throughout the accumulation phase, when institutional investors and smart money are accumulating assets at attractive prices. Traders often seek price stability, lower downside volatility, and increased volume, all of which suggest that selling pressure has been internalized. Once these qualities are identified, traders can start a purchase position when the market is ready for an upward in advance.
A breakout over the trading range or significant resistance level, coupled with high volume, is a common way to confirm a buy signal. Traders may also utilize additional technical indicators or price patterns to help validate the entry point. By strategically establishing purchase positions during the accumulation period, traders hope to profit from the subsequent mark-up phase, maximizing profit potential while limiting risk. Effective risk management, such as setting stop-loss orders and regulating position size, is critical for minimizing possible losses.
Wyckoff Trade Entry: Short Position
To start a short position using the Wyckoff Method, locate situations during the distribution phase when institutional investors and smart money are dispersing assets to less trained market players.
Traders often look for signals of greater volatility, frequent lower highs and lower lows, and expanding trading ranges to the negative, which indicate that selling pressure has surpassed buying demand. Once these traits are identified, traders may take a short position since the market is set up for a downward trend.
A decline below the trading range or a critical support level, complemented by high volume, is often used to confirm a short signal. Traders may also utilize additional technical indicators or price patterns to validate their entry point. Traders seek to make money from the resulting markdown phase by intelligently establishing short positions during the distribution time frame, while also utilizing appropriate risk management measures to minimize potential losses.
Bottom Line
In the early 20th century, Richard Wyckoff stated significant concepts for tops, bottoms, trends, and tape reading. His concepts, including the Wyckoff cycle, and rules, continue to assist traders and investors in the 21st century.