What is a trending market?
Trend trading can be a very profitable endeavor. When the price is volatile, breaking through previous support and resistance zones, even one trend trade can prove to be extremely profitable. This is why so many traders base their strategies around trading with the trend. In order to build a trend trading strategy, we need to better understand what a trending market is and how to identify one.
Liquidity
Liquidity is a vital ingredient in a trend-based strategy. That means that there are always enough buyers and sellers at all times. One of the most attractive features of forex trend trading is liquidity. Because forex traders are trading currency pairs, there is always a buyer and seller available.
When a stock folds, there are no buyers to take it off your hands. But in forex it is extremely rare for a nation’s currency to become worthless, so there will always be bulls and bears ready to take a position. This is also why, in general, a currency price is always hovering between a major high and a major low. Over the long term the price always comes back to the middle of the chart, the mean price.
Major pairs (pairs that include USD) are usually very liquid pairs. Liquid pairs can display major movements in the markets in a very short time frame. These extreme moves up or down are called trends, as if to say it is a new trend (popular in the short term) that the currency price is moving up or down to this extreme.
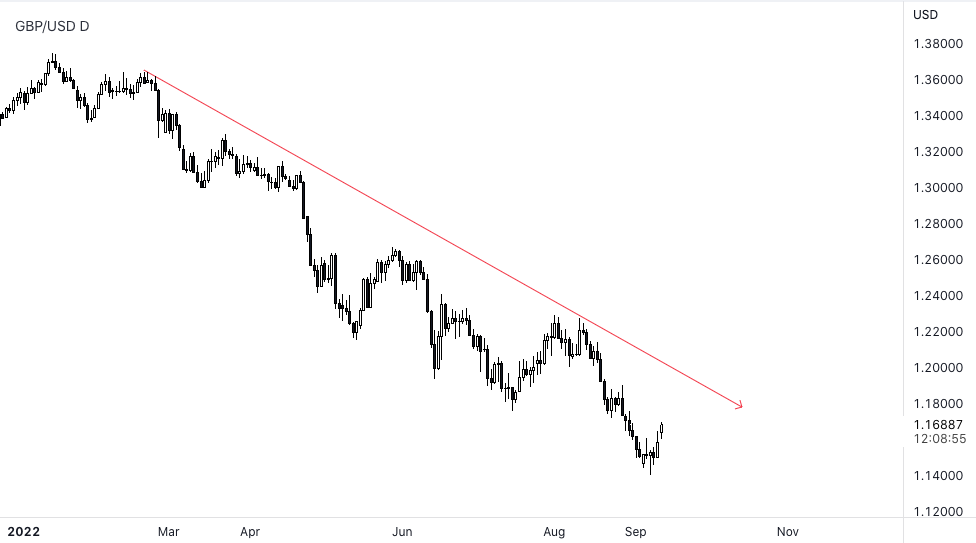
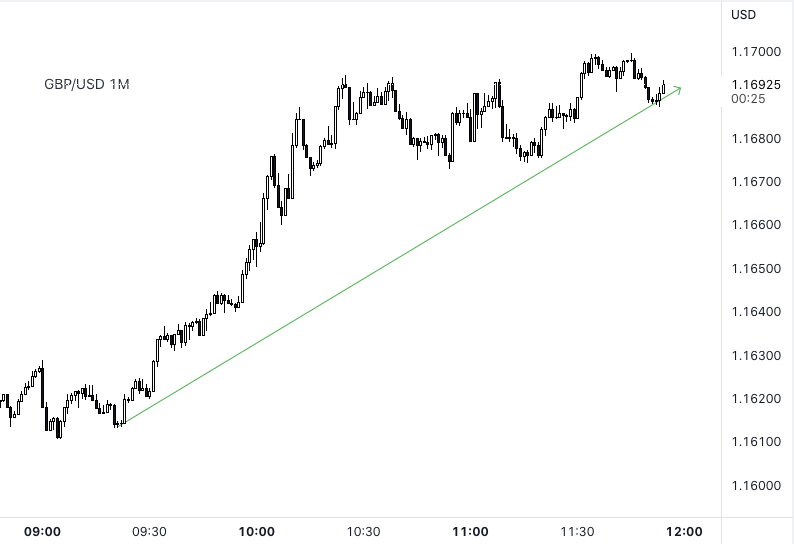
One last point before we learn how to identify a trend. Trending markets aren’t limited to long-term charts. Trends are found in short-term charts as well. For example, in the GBP/USD Daily chart below we can see a downward trend, but in the 1 MIN chart of GBP/USD that follows, the market is trending upward.
“Novice traders convince themselves a trending market will reverse, whereas professional traders jump onboard the trend and ride it”.
– Nial Fuller
How to identify a market trend?
There are a number of indicators that can determine if a market is trending. However, before we get into them it’s best if the trader can find the trend himself, without the support of any indicators.
To spot an uptrend on your chart, you want to find a series of higher highs and higher lows. To identify a downtrend you’re going to look for a series of lower highs and lower lows.
Usually a trader who develops a unique system will predetermine how many highs or lows is necessary to be considered a trend in his strategy. For example, a trader who speculates on the 5M chart might decide that unless the chart prints three higher highs followed by three higher lows, he will not consider it to be an uptrend.
Here are some indicators that can help you determine if the market is trending:
- Moving Averages.
- ADX.
- Bollinger Bands.
Moving Average as a Trend Indicator
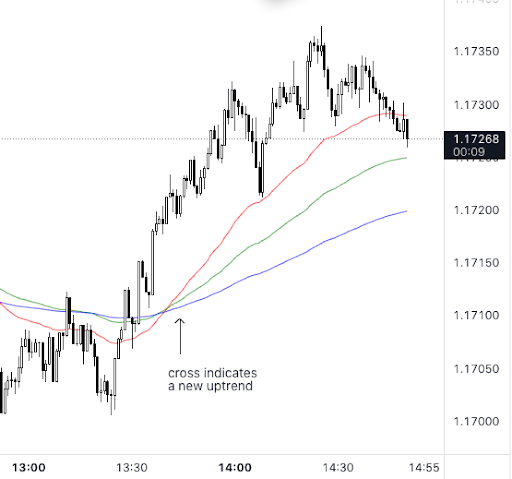
Many traders use the moving average indicator to determine if the market is trending. The best way to use the moving average indicator is to plot three simultaneous moving averages on the chart, one short term, one long term and one in the middle.
For example, a 5 candle simple moving average, a 15 candle average and a 50 candle average. This will plot three lines on the chart. One will show you the average price over the last 5 candles. The second will show you the average over the last 15 candles and the last one will show you the average over the last 50 candles. When the averages cross over each other, see below, it indicates the beginning of a trend.
ADX Trend Indicator
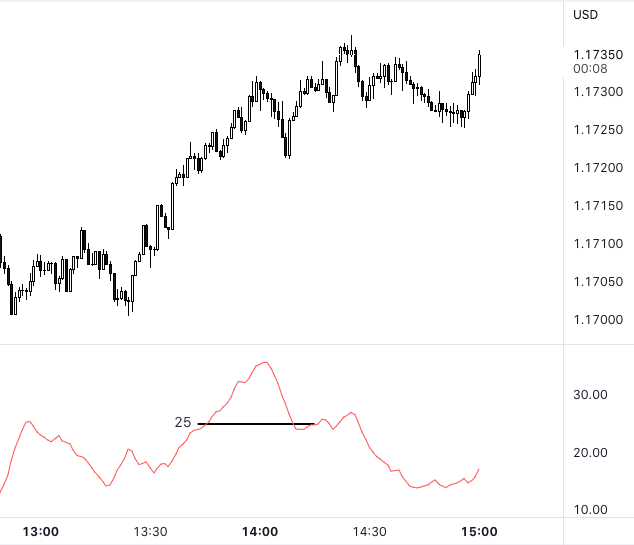
The ADX indicator helps differentiate between a ranging market and a trending market. The ADX indicator is a simple reading. You just set up the indicator and if it shows a reading greater than 25, it’s indicating that the price action above it is trending. A reading below 25 indicates that the market is ranging. See the same chart below and notice that the same place where the moving averages crossed has a reading above 25.
Bollinger Band to Determine the Trend
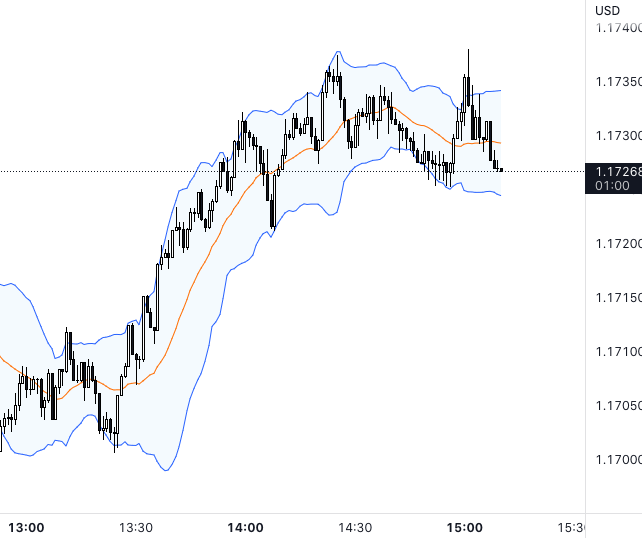
Bollinger Bands is a third indicator to help determine if the market is trending or ranging. When the bands are contracting, the market is ranging and when the bands are expanding it signifies that the markets are trending. In the chart below with the same price action we notice that between 13:00 and 13:30 the bands are contracted and between 13:30 and 14:00 the bands are expanded.
Final Thoughts
Putting all this together is what traders call confluences. Confluences are when multiple strategies or ideas converge and become one. So suppose that a trader wants to identify a trend; he might decide to rely on two or three confluences before making that determination. For example, the trader notices a higher high and higher low and then moving averages cross, that could qualify as two confluences. More confluences give traders greater confidence that their opinions are representative of the majority opinion in the market.
We hope this article provides a basic introduction to trending market indicators and helps you better identify a trending market. Good luck traders!