Price fluctuations in the financial markets result in patterns and trends that traders rely on to predict the direction price is likely to move. For example, fractals are a five-bar reversal pattern that occurs after a significant price move in a given direction. In this article, we are going to explore fractals, and fractal trading strategies.
Fractals Pattern Structure
Fractals are a five bars pattern that signals potential price reversal from the underlying trend. The pattern can either be bullish or bearish.
Bullish Fractal Pattern
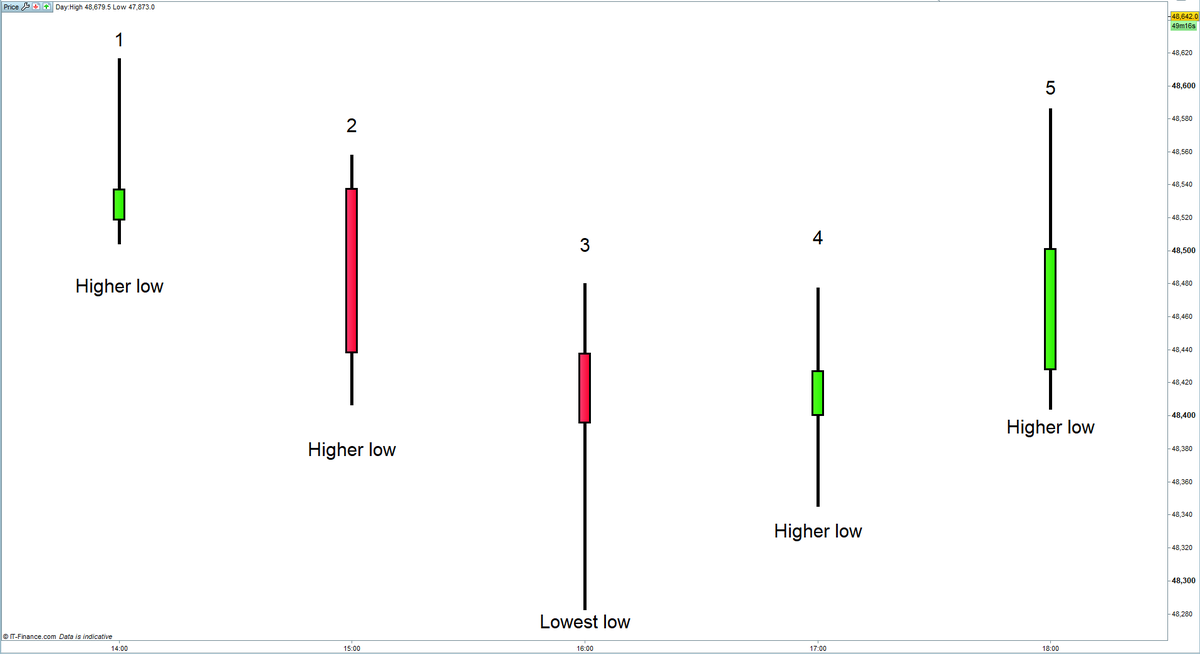
The pattern occurs when the price appears to be in a downtrend. The first candlestick appears as the price edges lower, making a higher low. The second and the third candlesticks also form higher lows, affirming the strong bearish momentum.
Source: Ig.com
Nevertheless, the emergence of a fourth bullish candlestick affirms waning downward momentum. While the candlestick has a higher low, it ends up closing above the previous low, signaling a momentum shift. The fifth candlestick opening and closing above the fourth candlestick signal a change in momentum from bearish to bullish, implying that the price is likely to increase.
A bullish fractal pattern is a reversal pattern that suggests the start of an uptrend from a downtrend. Consequently, traders can use the opportunity to open a buy or long position after the fifth candlestick closes to try and profit from further price rallies.

Source: Ig.com
Similarly, short sellers can also use the opportunity to exit the market as the emergence of the fifth candle in the bullish fractal pattern affirms a change in momentum from bearish to bullish.
Consequently, a bullish fractal pattern is synonymous with three successive candlesticks edging lower and forming lower lows. Then, the next two candlesticks start moving up, forming higher lows and signaling a momentum shift.
Bearish Fractal Reversal Pattern
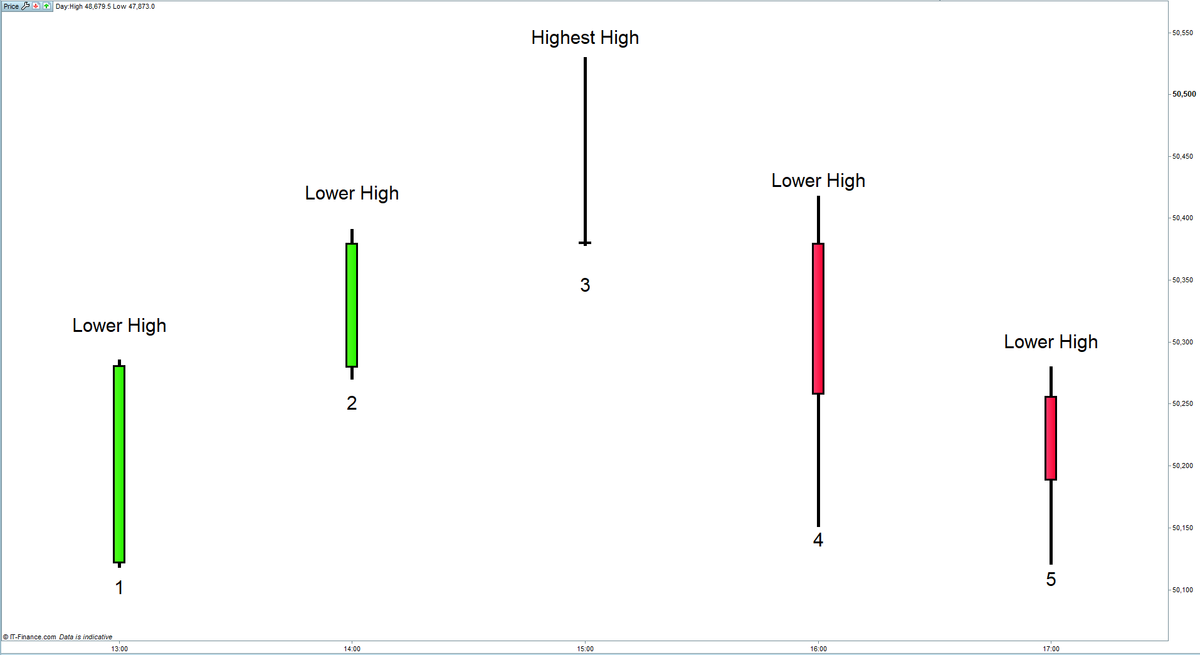
The pattern occurs when the price appears in an uptrend, trading above a key moving average. In this case, the first candlestick opens lower but closes higher. It is followed by a second candle that opens higher and closes higher, affirming the bullish momentum. Nevertheless, the third candlestick records a new high but closes lower, implying waning upward momentum.
Source: Ig.com
Despite recording a new high, the third candlestick closing lower is a warning sign of potential price reversal. The emergence of a fourth bearish candlestick with a lower high affirms bears are increasingly pilling pressure, and prices are likely to edge lower. The fifth and final candle in the Fractal pattern having a lower high confirms the change in trend from uptrend to downtrend.

Source: Ig.com
Consequently, the emergence of the bearish fractal pattern signals it is time to open a short position, as the price will likely edge lower. Similarly, traders who were long can use the opportunity to close their positions amid the change in momentum.
Therefore, a bearish fractal pattern occurs when three successive candlesticks show the price edging up, forming higher lows, followed by two candlesticks showing the price edging lower and forming lower highs.
Rules for Identifying Fractal patterns
- The focus should always be on the third candlestick or the middle candlestick. In this case, it should represent the highest point in a bearish fractal pattern or the lowest point in a bullish fractal pattern.
- A bearish fractal pattern occurs when two candlesticks that precede the middle candlestick form higher lows. The candlesticks are followed by two bearish candlesticks that form lower lows.
- Likewise, a bullish fractal pattern occurs when the two candlesticks that precede the middle candle or the lowest point show lower lows. On the other hand, the two candlesticks that follow the lowest point or the middle candlestick have lower highs.
Trading Fractals using RSI Indicators
Some of the best indicators used in conjunction with the fractal pattern to confirm potential price reversal are oscillator indicators. The Relative Strength Index is one such indicator that can provide insights into the likelihood of momentum shifting from bullish to bearish and vice versa as the fractals pattern form.
Bearish Fractal with RSI
The RSI indicator shows overbought and oversold periods in the markets. During this period, exhaustion tends to kick in, triggering price reversal. Consequently, whenever the RSI reading is above 70, it implies the underlying asset is bought too much.
This means that the price has increased significantly to the extent that buyers may not be willing to sell at the new highs. Therefore, when the RSI indicator is above 70, traders can look out for the formation of a Fractal bearish pattern that will signal a potential trend reversal.

Source: Ig.com
The chart above clearly shows that as soon as the RSI was above 70, signaling an overbought condition, the bearish fractal pattern was also forming. On the other hand, as soon as the RSI pulled below 70 and the fifth bearish candlestick in the bearish fractal pattern formed, the price dropped, resulting in a downtrend. Consequently, this was the best time to open a sell position.
While opening a sell position in the bearish fractal pattern, a trader might place a stop loss a few pips above the highest level of the fractal pattern. The stop loss will close the position should the price bounce back immediately and edge higher instead of lower.
Bullish Fractal with RSI’
Likewise, the RSI also signals when an underlying asset or security is sold too much. Whenever the RSI reading is below 30, it implies short sellers have pushed the price significantly lower to a level very few would be willing to continue selling. Short sellers tend to exit the market to lock in profits at this level.
As shorts sellers exit, the selling pressure tends to wane. It is at this level that a bullish fractal pattern tends to emerge.
Source: Ig.com
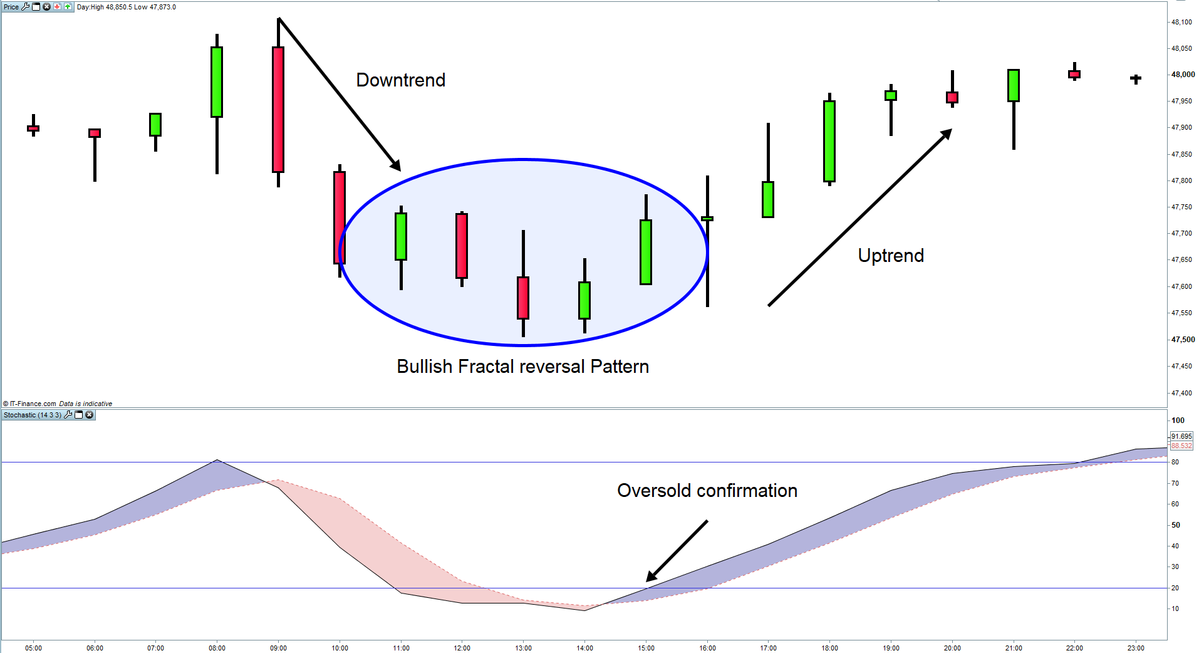
In the chart above, it is clear that the price was moving lower to the extent of the RSI tanking below the 30 level, signaling an oversold condition. With the RSI deep in oversold territory, the fractal pattern emerges with the formation of a third lower low candle immediately followed by two bullish candlesticks that signal a momentum shift.
The RSI moving above the oversold territory and forming two bullish candlesticks in the bullish fractal pattern confirmed a change in momentum from bearish to bullish. Consequently, traders can use the opportunity to open buy positions.
While opening a buy position, a trader may place a stop loss a few pips below the third candle’s lowest level or the fractal pattern’s lowest point.
Bottom Line
Fractals are one of the most reliable trend reversal patterns made up of five candlesticks. The bullish fractal pattern occurs when the price is a downtrend, followed by a bounce back. Likewise, the bearish fractal pattern occurs in an uptrend, with price forming higher lows, which is followed by a pullback from the highest point. The pattern offers the advantage of making it easier for traders to identify market entry points at the close of the fifth candle.