Most traders depend on technical indicators to identify imbalances in the financial markets. The technical indicators provide insight into market momentum and help determine prices. Likewise, other traders closely watch key levels in price action where most actions tend to occur, leading to sharp price movements. Supply and Demand zones are crucial price levels created by banks and other large institutions from where big trends emerge.
What are Supply and Demand Zones in Forex?
Within a pricing chart, supply and demand zones are regions where prices consistently approach each other. Here, buyers and sellers engage in fierce conflicts that frequently lead to consolidation and a subsequent price explosion.
Supply Zone in Forex
The supply zone on a price chart is where traders look to sell the market. It is also referred to as the distribution zone. The zone is primarily present after a substantial price increase, which gives big institutions and individual traders a chance to liquidate high. As the zone is situated above the present price level, it offers the greatest opportunity for selling.
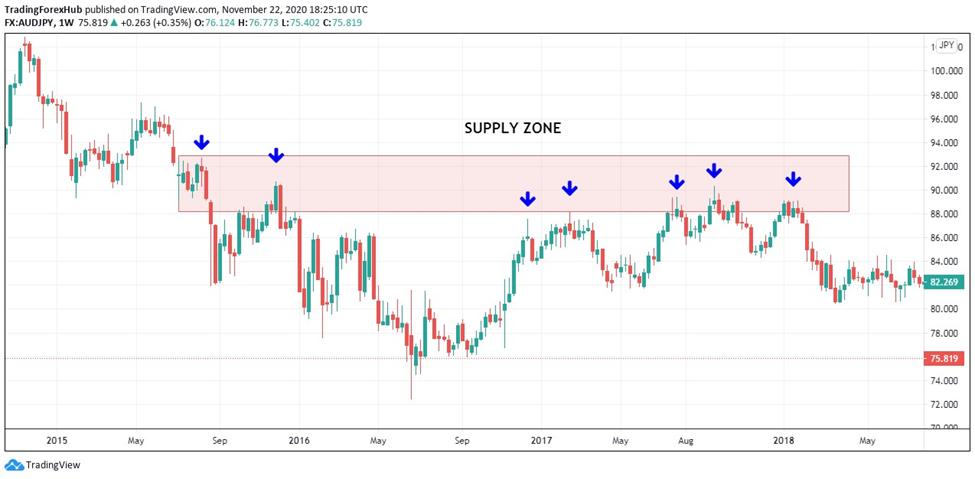
Source: Tradersunion.com
The price action chart of the AUDJPY is displayed above. The currency pair was in a decline at first, but it eventually flipped around and began to go higher. But it seems that a significant supply zone was reached during the rebound, making it harder for buyers to drive the price higher.
The price struggles to climb higher because the supply zone is an area of significant demand, marked by huge institutions placing large sell orders. As a result, it serves as a zone of intense resistance, where suppliers swarm the market in an attempt to drive down prices by placing sell orders.
Demand Zone In Forex
Beneath the current price level is the accumulation zone, which is also known as the demand zone. Since major institutions typically place more buying orders in an attempt to buy low, the area is characterized by considerable buying interest or potential.
As an outcome of buyers’ mounting pressure, sellers find it difficult to drive prices lower in the demand zone, which serves as a strong support level.
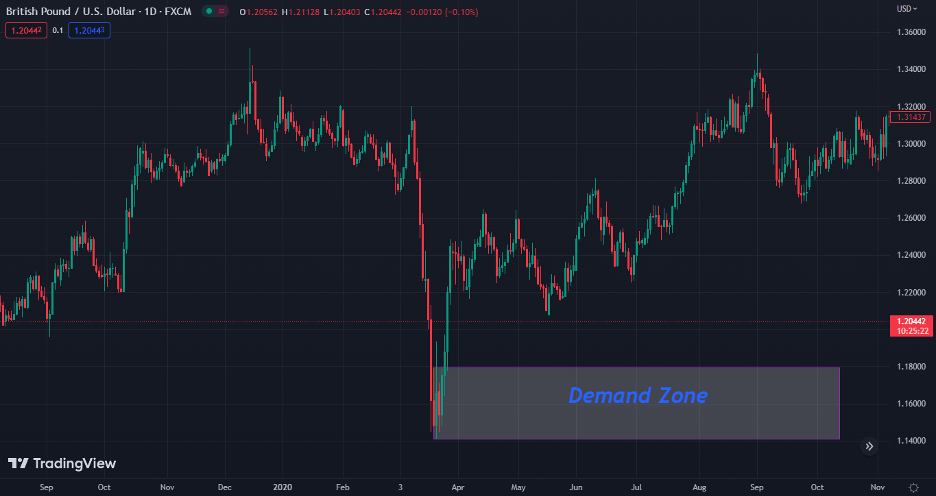
Source: howtotrade.com
The above AUDJPY price chart makes it obvious that bulls were in charge of the market during the early upswing. The price bounced back each time it reached the demand zone, making it difficult for sellers to manufacture a downward move. The seller’s inability to drive down the price indicated that big institutions, who had originally placed buy orders to drive up the price, were well-positioned to defend the area.
Pros and Cons of Supply and Demand Trading
No trading system is flawless, just like any other. To use a trading system efficiently, one needs to have a solid trading mentality and frequent practice.
The basic pros of supply and demand trading forex are as under:
- The framework for trade is straightforward by the laws governing supply and demand trade. The success of it has persisted throughout time because it is based on the most fundamental idea in economic theory.
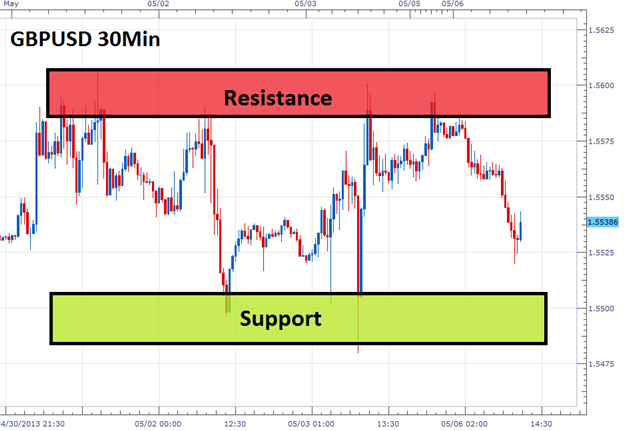
- Combining traditional support and resistance concepts with supply and demand forex trading strategy can help traders understand price movements in a much clearer way.
Whereas the cons include:
- Supply and demand zone trading isn’t a stand-alone trading strategy. When used together with other technical analysis tools, its efficiency will increase. While the data may be objective, the interpretation of that data can be subjective, differing from one trader to another.
- Moreover, supply and demand trading requires significant time and effort to identify key price levels, keep levels up to date, find setups, and execute trades.
How to Find Supply and Demand Zones?
Locating places on the price chart where there have been significant price swings is the first step in determining supply and demand zones. As a result of the quick price movement, prices should move in one direction with little to no resistance.

Source: dotnettutorials.net
Once you have located the significant price movement, identify the level where the movement began. A critical supply and demand zone that deepens the direction of price movement is frequently the level at which a strong movement begins.
The best way to find a supply and demand zone
Identifying regions with strong consolidation using longer periods is the most effective method to figure out the supply and demand zone. Potential supply and demand zones are clearly visible on supply and demand charting with intervals of four hours, day, and week. Rectangular shapes must be used to indicate this zone, which should serve as support and resistance levels, across extended time horizons.
Furthermore, keep an eye out for significant movements away from possible supply and demand zones. Any significant shift indicates considerable momentum in the new direction and validates the momentum that was first created by big institutions placing orders. The price will consistently diverge sharply from the supply and demand zone until the big institutions accomplish their goal or the value has fallen.
Another crucial technical analysis tool for identifying supply and demand zones is the Fibonacci indicator. Pullbacks and bouncebacks frequently take prices to important supply and demand locations, since prices don’t always go in one direction.
How to Draw Supply and Demand Zones?
Begin with the identification of notable swing highs and lows, and draw supply and demand zones on a price chart. Potential imbalances in supply and demand in forex may exist in these sectors. Mark the zones here by drawing rectangles around them. Apply the same standards to various assets and periods to maintain consistency and stability. Make sure there is a strong volume during price reversals and that there are noticeable price reactions by validating zones with volume and price movement. To change the market circumstances, adjust the zones on an ongoing basis.
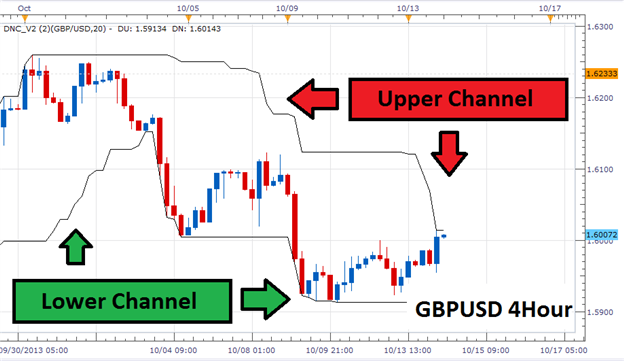
Put price action and volume first, even though indicators like moving averages and support/resistance lines can enhance supply and demand research. In addition to being essential for precise zone identification, they provide clear insights into market sentiment. Furthermore, gaining proficiency in this area helps traders predict possible price changes and enables them to make wise trading choices.
Rules of Supply and Demand Zones Trading
Although there are numerous consolidation sectors to be aware of, what makes a zone more trustworthy? There are several rules which serve as the core of supply and demand zone trading. Below are some supply and demand trading rules:
- Supply areas are places where the supply of goods or services is expected to be greater than the demand, resulting in a price decline. Demand zones are regions where there is an expectation that there will be more buyers than sellers, driving the price up. By doing that, it would be possible to find places where prices have strongly reacted in the past.
- It is very important to wait for a confirmation of a supply or demand zone before putting any trade. This can be expressed as a strong rejection candlestick formation, like a pin bar or engulfing pattern, occurring at or near the support zone.
- Check supply and demand zones by looking at them on different time frames. This, in turn, keeps you in line with the main trend and improves the robustness of the zones.
- Practice on high-quality supply and demand zones rather than trying to trade all possible zones that you see. Search for the zones that have been tested many times or the intersections within other technical indicators, like trend lines or Fibonacci levels.
- The stop-loss orders should always be utilized and the potential reward should be worth the risk.
How to Trade Supply and Demand Zones in Forex?
Traders can try to enter sell positions in expectation of the price moving lower later. As such, it is essential to place a stop-loss order a few pips above the supply zone while placing a sell order below it. If the price does not move lower after the supply zone consolidation, the stop-loss order will close the sell order.
Similarly, the demand zone is characterized by an influx of buy orders. It is usually quite likely that the price will move slightly above the demand zone. A few pips below the demand zone is where stop loss orders should be positioned. Once the price fails to go above the demand zone and begins to move downward, this will cease any purchase positions.
Supply and Demand Forex Trading Strategies
At these levels, trading supply and demand zones are reduced down to the unique dynamics. The top methods for trading supply and demand zones in forex are provided below.
Range Trading Strategy
One can use a range trading method with a certain level of success, given the consolidation in the supply and demand zones. As the price approaches the supply zone, a level of extreme selling pressure traders using range trading can try to sell. Retail traders may opt to sell in anticipation of a price decline, as major organizations are progressively initiating short positions at this stage.
As soon as the price falls into the demand zone, which is a zone with strong purchasing pressure, one can likewise try to enter a buy position. As more and more entities are putting purchase orders, it is possible to place a buy order in anticipation of the price bottoming out and rising.
Source: Dailyfx.com
Breakout Strategy
Another essential strategy for improving the supply and demand zone in forex is a trading breakout strategy. In the forex market, the price can never stay limited within a particular trading range. It occasionally explodes upon gaining momentum in a certain direction.
Similar to this, one can use the momentum indicator Stochastic to figure out when to enter buy and sell positions in the demand and distribution zones, respectively. First off, overbought conditions are indicated whenever the stochastic reading rises above 80, and there is typically a good chance that the price will reverse course and leave the supply zone. It is therefore the perfect level to go short. In addition, an RSI reading below 20 indicates oversold conditions, which are perfect for buying opportunities as you wait for the price to rise again.
For example, during lengthy instances of supply zone consolidation, the price would eventually break out and begin to decline when substantial sell orders were placed by short sellers. The price will gradually drop if there is substantial selling pressure.
Similarly, in the demand zone, it is common for the price to rise and for big institutions to grab the chance to place purchase orders, which builds up upward momentum. As a result, a trader may try to initiate a buy position to benefit from the price rise and quit the accumulation zone.
Source: Dailyfx.com
By supply and demand zones, prices often fluctuate in a preset direction. For example, the price may not rise from the demand zone. If buyers don’t put up large buy orders to offset the supply zone’s selling pressure, it may find up creeping lower.
The price ultimately broke out of the demand zone to the downside, as can be seen in the preceding chart. Verifying strong selling pressure coming from the supply zone.
Bottom Line
One of the simplest methods to get an advantage in forex trading is to learn how to recognize supply and demand zones. These price action zones are crucial because they are the starting points of major movements given the consolidation. When big institutions issue sell orders, there is typically a good chance that the price will drop later on if it is a supply zone. Similarly, huge institutions placing purchase orders usually have a greater chance of witnessing the price burst and moving up if it is a demand zone.