Scalping is one of the most popular trading strategies traders use to profit from short-term price movements. Traders use short-term price charts to identify price movements and then open and hold positions for less than five minutes. The goal is to open and close as many positions as possible throughout the trading day while locking in small profits.
Scalpers can open more than 20 trades daily and make small profits from each. Technical indicators enable scalpers to identify ideal entry and exit levels in the market. In addition, the indicators provide valuable insight into the prevailing momentum, either bullish or bearish.
Below are some of the top indicators scalpers use to scalp various financial instruments.
Relative Strength Index
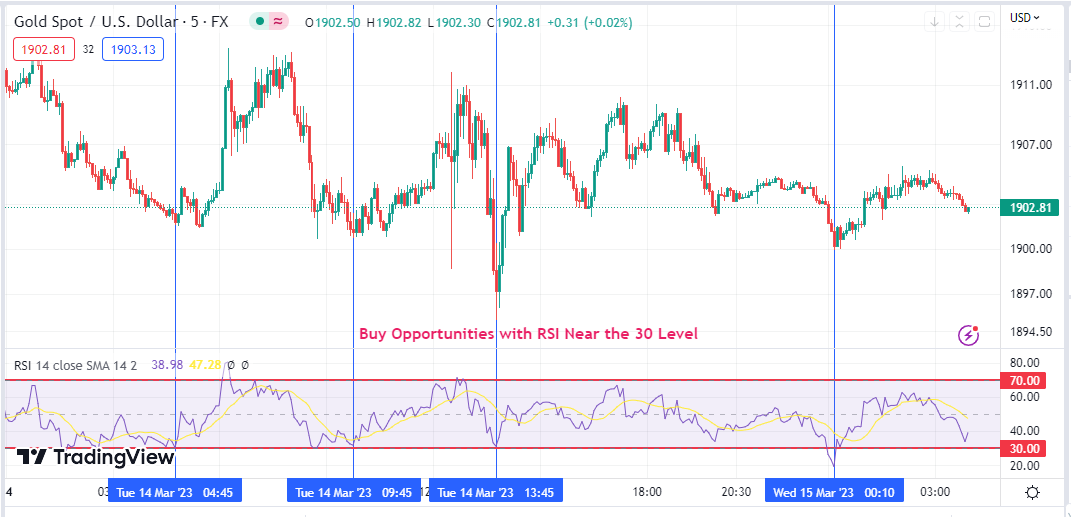
It is a momentum indicator that provides valuable insight into the prevailing market conditions and momentum. The indicator has readings between 0 and 100. Readings of below 30 imply the underlying asset is sold too much, signaling a potential price reversal to the upside.
Source: Tradingview.com
Whenever the RSI reading is below 30, scalpers look to enter buy positions in anticipation of the price bouncing back and increasing.
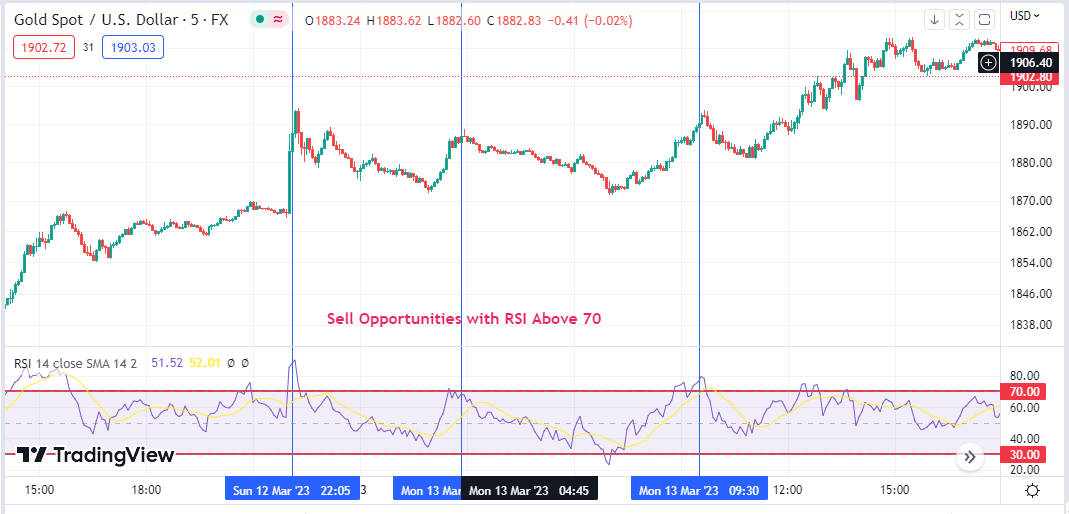
On the other hand, whenever the RSI reading rises above 70, it implies the underlying asset is bought too much. The high reading suggests a potential reversal. Consequently, scalpers use the opportunity to eye potential sell or short positions as momentum shifts from bullish to bearish.
Source: Tradingview.com
A scalper would open buy positions as soon as RSI tanks below 30 and changes direction to start moving up. The position would be closed as soon as the indicator rises above 70 as it implies a potential reversal on the asset being bought too much.
Likewise, the scalper would open sell positions whenever the RSI reading rises above 70 and then change course to start moving lower. The positions would be left open until the RSI tanks below 30.
Moving Average Convergence and Divergence Indicator
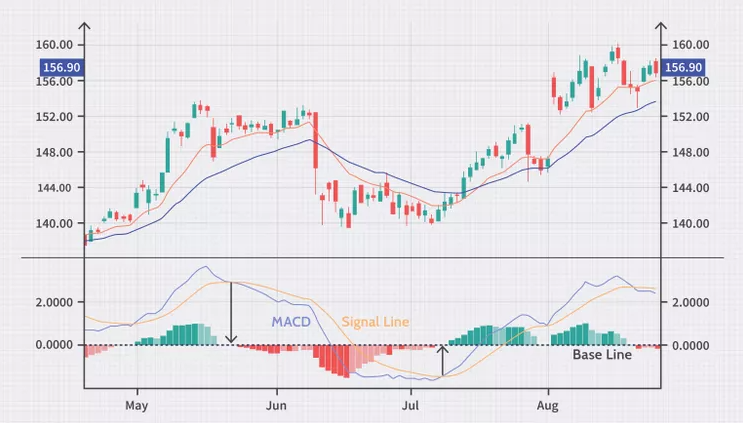
The Moving Average Convergence and Divergence (MACD) Indicator is an indicator that allows scalpers to open trades in the direction the price is moving. The trend following indicator consists of two exponential moving averages, a fast-moving and slow-moving. In addition, it comes with a histogram that implies market momentum and its strength.
The lower moving average, usually a 12-day exponential moving average, acts as the MACD line. On the other hand, the longer moving average, usually a 26-day exponential moving average, acts as the signal line. The histogram appears below and above the baseline and affirms the strength of the bearish or bullish momentum.
Source: Investopedia.com
Whenever the MACD line moves and crosses above the Signal line, it implies a change in market direction from bearish to bullish. Scalpers can use this opportunity to enter a buy position. The histogram appearing above the baseline and increasing in size signals an increase in buying pressure, suggesting that the price is likely to continue increasing.
On the other hand, whenever the MACD line crosses the signal line and starts moving lower, it implies a change in market direction from uptrend to downtrend. Consequently, scalpers can use the opportunity to eye short or sell positions. The prospect of price edging lower is usually high, especially on the histogram appearing below the baseline and increasing in size to the downside.
Scalpers will open buy positions whenever the MACD line moves above the signal line and only exit whenever a crossover happens and the MACD moves below the signal line. Similarly, short or sell positions would be opened whenever the MACD line moves below the signal line, and positions closed whenever the MACD Line moves back up above the signal line.
Bollinger Bands
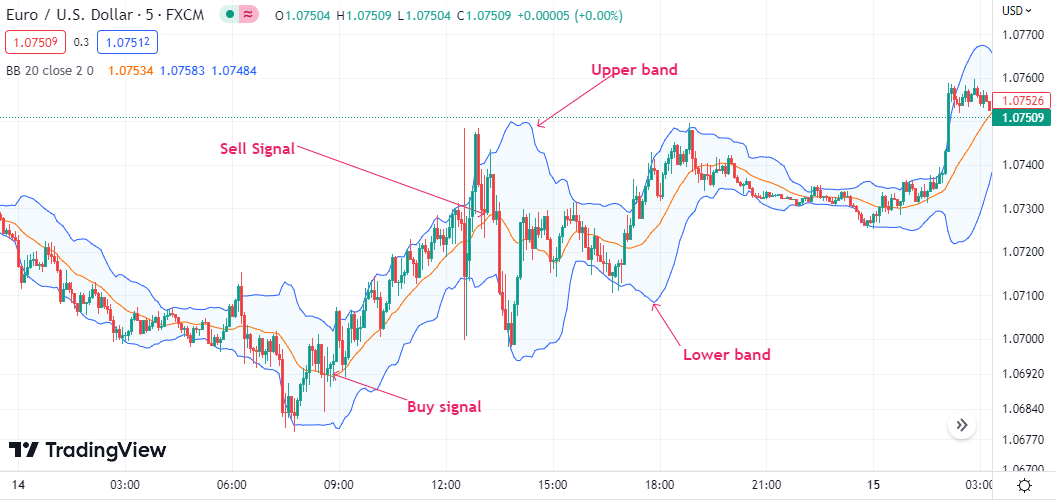
It is another popular scalping indicator that combines moving averages and standard deviation. The indicator has two bands, the lower and the upper, that act as standard deviations from the average position. In addition, there is a moving average in the middle.
In balanced market conditions, whenever bulls or bears are neither in control, the Bollinger band tends to be small, with the price oscillating near the moving average in the middle. In addition, the lower and upper bands are so close to one another.
The price will move in either direction whenever there is a strong market shift. For instance, scalpers can look to enter a buy position as soon as it moves above the middle line or moving average and starts moving up. If the price is above the middle line and the upper band, it is considered an uptrend and traders trigger buy or long positions.
A scalper would look to enter the buy position as soon as the price reverse course moves, closes below the middle line, and starts moving towards the lower band.
Source: Tradingview.com
On the other hand, a scalper would trigger a sell position as soon as the price moves below the moving average in the middle and starts moving lower.
Such an action signals a momentum shift from bullish to bearish. The trader will leave the sell position open if the price is below the middle line or the moving average.
The sell position would be closed as soon as the price reversed course and started moving up to the extent of crossing the middle line and starting moving toward the upper band.
Parabolic SAR Indicator
Parabolic SAR is another trend-following indicator that gives scalpers an idea of how the price will likely move. The indicator consists of dots above and below the underlying asset’s market price.
A scalper can enter a buy position as soon as dots appear below the price. The dots below the market price imply a shift in market momentum from bearish to bullish. It signals a change in direction from a downtrend to uptrend. The scalper will keep the buy position open if dots don’t appear above the market price.
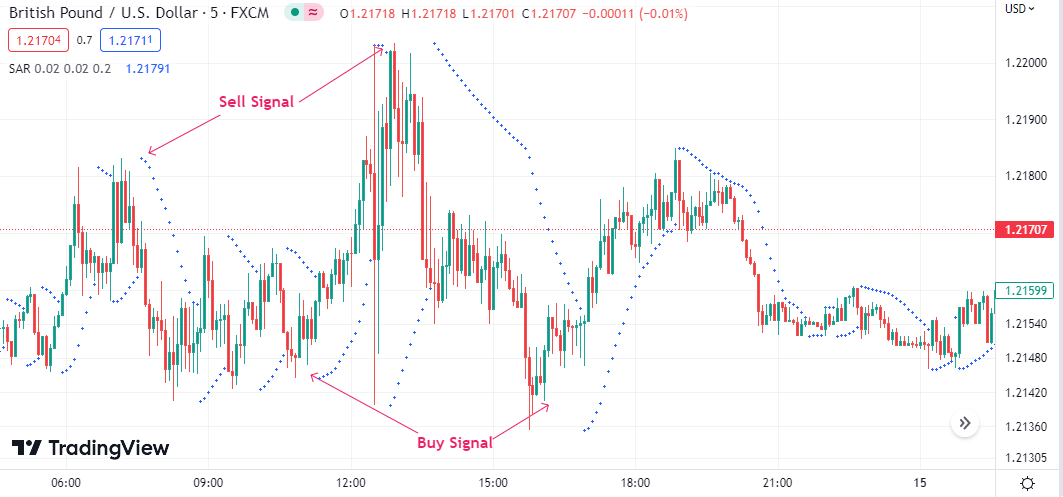
Source: Tradingview.com
Likewise, a sell position is opened after a significant move to the upside, followed by the emergence of the dots above the market price. The emergence of the dots followed by a signal in the form of a bearish candlestick implies price will likely start moving lower. The sell position would be left open as long as the dots don’t appear below the market price. Once the dots appear below, the position is closed.
Moving Average Indicator
The moving verse indicator provides the average price of an underlying asset over a given period. Consequently, it is commonly used in scalping as it provides valuable insights into the direction price is likely to move.
When it comes to scalping traders, use two moving averages to ascertain ideal entry and exit levels. A fast-moving average is used to signal to buy and sell signals, while a slow-moving average is used to affirm the direction price is likely to move. For instance, a trader can use a 21-day moving average as the fast-moving average and the 200-day moving average as the slow-moving average.
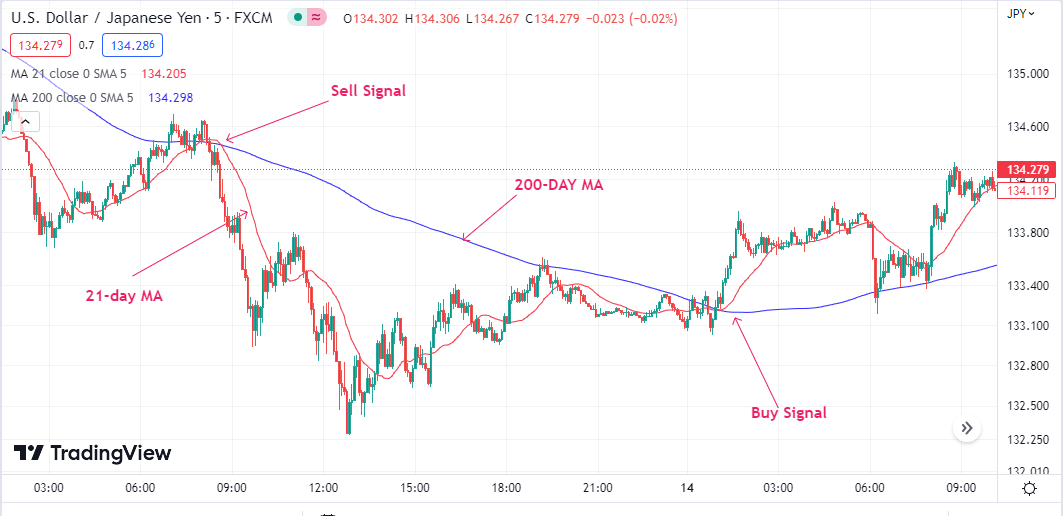
Source: Tradingview.com
Consequently, the scalper can look to enter a buy position whenever the 21-day MA moves above the 200-day moving average. The crossover implies a change in trend from a downtrend to an uptrend. The position is to be left open as long as the price remains above the 21-day MA and closed when it moves below the 200-day MA.
Similarly, a sell position would be opened as soon as the 21-day MA moves below the 200-day MA, implying a change in trend from uptrend to downtrend. The sell position would be left open for as long as the price is below the 21-day MA and closed when it moves above the 200-day MA.
Frequently Asked Questions
Yes, scalping indicators can be used together for more accurate trading signals. For instance, the RSI can be used to affirm bullish or bearish momentum and the moving average to affirm trend direction up or downward.
The easiest trading strategy is one that makes it easy to identify the ideal entry and exit levels in the market. In addition, the strategy should be able to affirm market momentum and trend.
Yes, scalping can be challenging as it entails making quick decisions to try and profit from the slightest price movements. Additionally, it requires traders to spend hours glued to the screen, opening and closing positions.
In most cases, people scalp using a time frame of between 1 and 15 minutes. The lower the time frame, the better, making it easy to identify small price movements.