Most brokers offer the RSI (Relative Strength Index) technical analysis indicator. It stands out for its ability to signal whenever an underlying instrument is sold too much or bought too much. Additionally, the technical indicator provides valuable insight into the underlying trend while signaling potential areas of price reversal. Read on to learn more about the top RSI trading strategies that can help you make better trading decisions.
Understanding the RSI indicator
The RSI is a momentum indicator with readings between 0 and 100. Whenever the RSI readings are above 70 indicate overbought conditions. What this means is that buyers have bought the underlying asset too much. The likelihood of momentum shifting from bullish to bearish under these conditions is usually high as few traders are willing to buy at extreme highs.
When the RSI readings are above 70, savvy traders have been exiting the market by taking profits. On the other hand, short sellers use the opportunity to open short positions to take advantage of the extremely high prices.
On the other hand, whenever the RSI readings are below 30, they imply oversold market conditions. What this means is that the underlying asset price has tumbled significantly. While the price can continue dropping, a reversal often occurs as savvy traders who were short exit by taking profits.
Likewise, buyers on the fence start looking for ideal levels to trigger buy positions to take advantage of the extremely low prices. Therefore, whenever the RSI reading is below 30, the prospect of price bouncing back is usually high as sellers exit and buyers enter the market resulting in a momentum shift from bearish to bullish.
Using the RSI Indicator for Trend Confirmation
The middle line, usually at the 50-level, is also of interest when using the RSI indicator. Whenever the RSI indicator moves from oversold conditions and rises above the 50-level. It confirms a shift in momentum from bearish to bullish, signaling the market is trending up. Consequently, technical analysts use the opportunity to eye long positions.
Similarly, whenever the RSI is reading tanks below 50 from the overbought levels, it implies a shift in momentum from bullish to bearish. Consequently, technical analysts use the opportunity to enter sell or short positions as the prospect of price plunging is usually high, going by the buildup in selling pressure.
Therefore, the RSI indicator can signal an uptrend or downtrend in addition to confirming the prevailing market condition, oversold or overbought.
RSI Trading – MACD Combination
While RSI can be used to generate trading signals, it does not provide reliable trading signals when used in isolation. However, combined with other indicators, it generates some of the best trading signals.
One of the biggest downsides of the RSI indicator is that the price can remain in an oversold or overbought condition for quite some time. Therefore, one cannot enter a short or long position just because the indicator indicates the asset is overbought or oversold.
One must rely on another indicator to be sure when the price will likely reverse from an uptrend in case of overbought conditions and start moving lower. Similarly, the technical indicator must signal the appropriate time to enter a long position whenever oversold conditions kick in.
The Moving Average Convergence and Divergence (MACD) is one of the best momentum indicators to use with the RSI for the best outcomes. The MACD stands out for its ability to signal whenever momentum shifts from bullish to bearish or vice versa.
The indicator comes with two moving averages, one fast-moving and another slow-moving. Whenever the fast-moving MACD line crosses the Signal line and starts moving up, it affirms the momentum shift from bearish to bullish. On the other hand, whenever the MACD line crosses the Signal Line and moves lower, it signals a momentum shift from bearish to bullish.
RSI Trading Strategy
Equipped with the RSI and the MACD indicator, it becomes pretty easy to identify the ideal entry and exit levels as prices oscillate up and down on the chart.
Strategy 1: Going Short in Overbought Conditions
Whenever the RSI indicator suggests the underlying asset price has increased significantly due to increased buying pressure leading to overbought conditions, it would be wise to watch out for potential trend reversals.
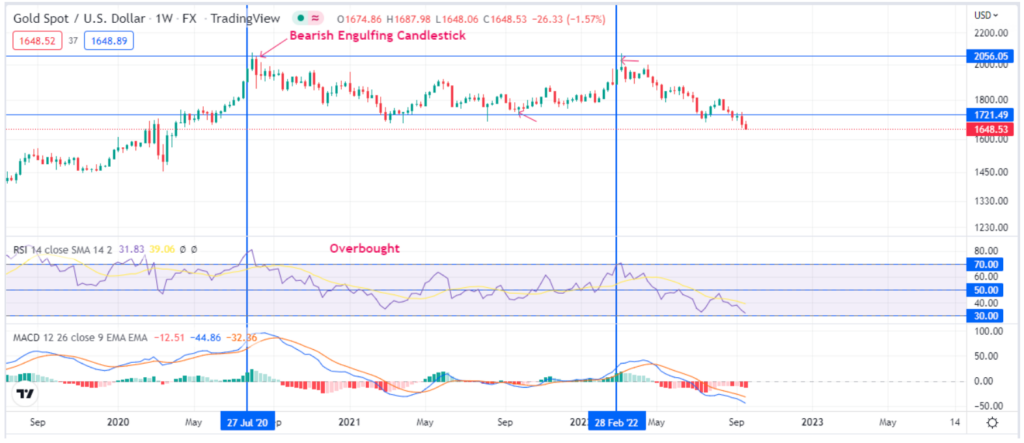
The chart above shows Gold price action. Between September 2019 and July 2020, it is clear that gold prices were trending up with the RSI above the 50-line. In early July 2020, overbought conditions started ringing bells, with the RSI reading way above the 70-level. However, prices continued making higher highs going by the bullish green candlesticks.
However, a closer look at the MACD indicator started caving in at the top of the chart resulting in the MACD line (in blue) crossing the signal line (in orange) and starting to move lower. The crossover affirms a shift in momentum from bullish to bearish, thus affirming a trend reversal from uptrend to downtrend.
The formation of a large bearish engulfing candlestick at the top also confirms that bears have overpowered buyers and are poised to push prices lower. Following the closure of the bearish
engulfing candlestick with the RSI and the MACD indicators pointing lower. This would be the ideal time to trigger a short or sell position with a stop loss a few pips above the previous high.
Strategy 2: Going Long on Oversold Condition
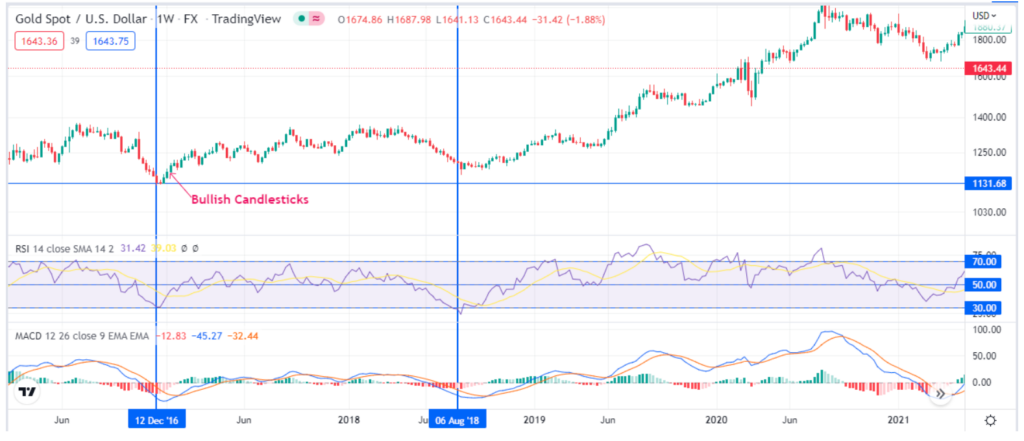
When the RSI indicator readings are below 30, one should watch out for potential price reversal from the downtrend to the uptrend. With oversold conditions in play short, sellers tend to exit, presenting an opportunity for buyers on the fence to enter long positions.
While the price can continue moving lower even with oversold conditions in play, the MACD indicator can provide early signals of a change in momentum from bearish to bullish.
The gold chart above shows that the price was trending lower between July and December 2016. As prices tumbled, oversold conditions started appearing in early December, with the RSI dropping to the 30 level. Additionally, the histogram on the MACD indicator was high, affirming the strong bearish momentum below the zero line.
However, the price struggled to drop below the $1136 level as sellers started locking profits and buyers started opening buy positions. Afterward, the MACD line crossed the Signal line and began moving up. The histogram above the zero line was also becoming bigger, confirming a buildup in buying pressure.
The formation of three bullish candlesticks confirmed that gold had bottomed out and was well poised to edge higher. Traders who used this opportunity to enter long positions at extremely low positions ended up accruing significant pips and profits. A stop-loss order was opened a few pips below the lowest level, which worked well as the price never retreated from the emerging uptrend.
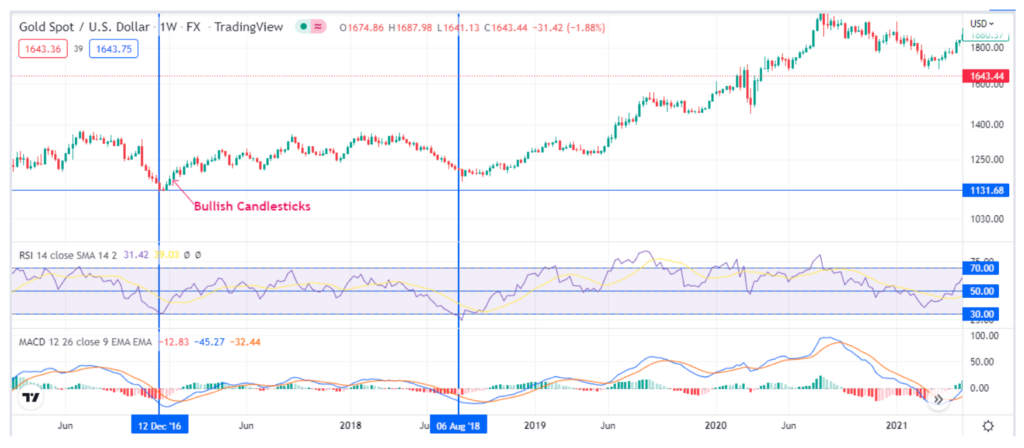
Another buy signal emerged in August as the RSI plunged below the 30-level, signaling too much selling of gold. Afterward, the MACD line crossed the signal line and moved up, affirming the momentum shift from bearish to bullish.
Strategy 3: RSI Divergence Strategy
In most cases, the RSI indicator moves in the same direction as the price. If the price increases, the RSI will also trend up; if the RSI points lower, the price must also drop. However, that is not always the case. At times the RSI diverges from the price and moves in the opposite direction.
The RSI and price moving in the opposite direction is usually a sign of weakness in the underlying trend. Conversely, if the price continues to rise even as the RSI moves low, the upward momentum is waning, and that price is likely to correct and move lower afterward.
Similarly, if the RSI is moving up, but the price continues moving lower, making lower lows, it signifies waning selling pressure. It means that after some time the price will correct and start moving up in the direction of the RSI.
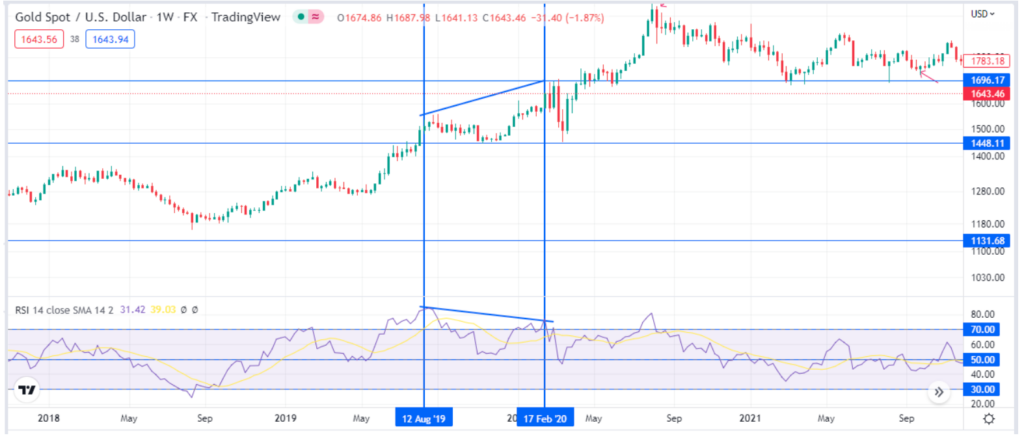
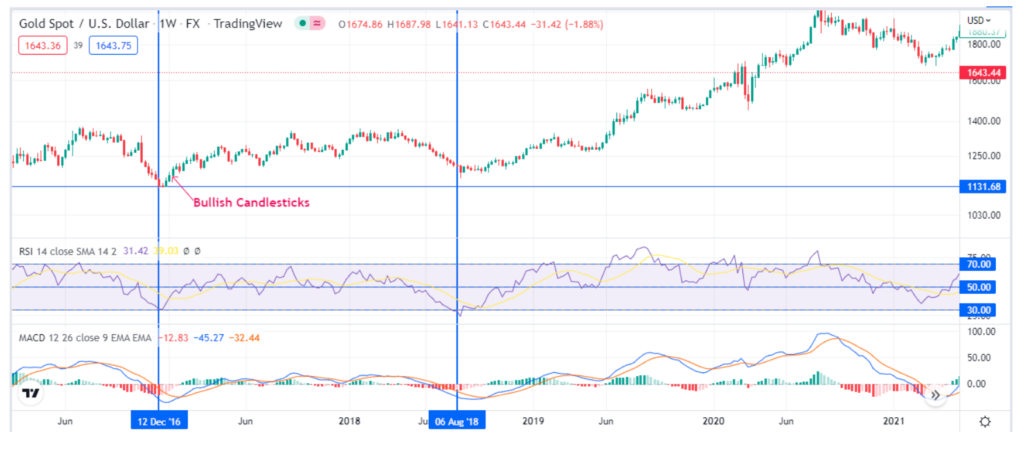
In the gold price action chart above, gold was trending up, making higher highs between August 2019 and February 2020. However, instead of the RSI indicator moving in tandem and making higher highs, it moved lower.
The divergence between the price and the RSI confirmed weakness in the underlying uptrend. Gold plunged from highs of $1696 at the end of February to lows of $1448. The divergence provided an early signal for technical analysts to position potential selling opportunities.
Bottom Line
The Relative Strength Index is a vital technical analysis indicator for determining prevailing market conditions. With readings above 70, it implies overbought conditions, an early warning sign of potential price reversal from uptrend to downtrend. Similarly, readings below 30 suggest oversold conditions signaling the likelihood of price bounce back after some time.