Candlestick and chart patterns are essential tools in the technical analysis of the forex and other financial markets. Identifying candlestick and chart patterns is crucial for any trader looking for an edge in price prediction. While some traders use them interchangeably, they mean two different things. Knowing the difference is essential for anyone looking to profit from the financial markets through technical analysis.
Understanding Candlesticks in Forex
Candlesticks show emotion in the market by representing the size of price moves. A candlestick packs data for different times into one single price bar. The data includes the opening and closing prices for a given period. It also shows the highs and lows reached during the period.
While one candlestick can shed more light on the prevailing market conditions, a group of candles together form vital forex patterns. They provide more data on what buyers and sellers are doing and what the price is doing. Candlestick patterns predict the direction the price is moving.
Candlestick pattern forex is broadly classified into two categories. A bullish candlestick pattern suggests the price is in an uptrend and poised to make higher highs. On the other hand, bearish candlestick patterns suggest the cost is in a downtrend and poised to make lower lows.
Bullish Candlestick Patterns
Bullish Candlestick patterns show bulls have overpowered bears and assumed control of price action. With bulls in control, the price tends to edge higher after forming the bullish candlestick pattern. Some of the popular bullish candlestick patterns in forex include:
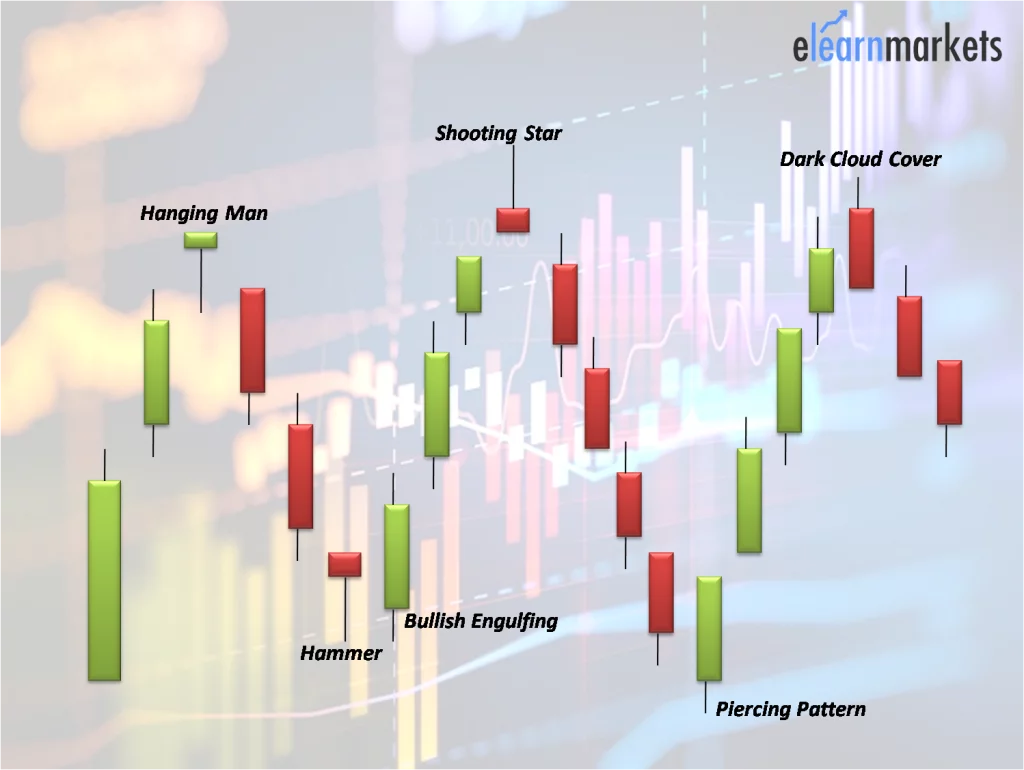
The Hammer: The candlestick pattern shows that sellers pushed prices lower but came under pressure from bulls, who pushed prices higher. The long wick to the downside affirms low price rejection by bulls. It mainly occurs at the bottom of a downtrend.
Bullish Engulfing: A typical bullish candlestick appears after the price has tanked significantly. Characterized by a large bullish candle that engulfs the previous bear candlestick. The forex pattern signals that bulls have overpowered the bears and are poised to instigate higher prices.
Morning Star is a three-candlestick pattern that forms after the price has plunged significantly. The pattern starts with the price gapping lower, characterized by a large candlestick to the downside. Afterward, a small, bearish, bullish candlestick emerges at the base, affirming waning downward pressure. Finally, price gapping higher, followed by a large candlestick, asserts price reversal with bulls now in control.
Bearish Engulfing Candlestick
Bearish engulfing are forex patterns that occur at the top of a price chart after the price has moved up significantly. Therefore, they help signal a potential price reversal.
Hanging Man: The bearish version of the hammer occurs at the top of an uptrend. It appears as an inverted hammer signifying bulls tried to push the price higher but came under pressure from bears. Consequently, the candle ends up with a long wick at the top and a small bullish body.
Shooting Star: It is similar to the hanging man pattern and comes with a small bearish body whose size is half the size of the upper shadow. Sometimes the candlestick has little or no lower shadow.Bearish Engulfing: The patterns surfaces at the end of an uptrend signaling a change in momentum from bullish to bearish. The pattern consists of one large bearish candle that engulfs the previous bullish candle.
Understanding Chart Patterns in Forex
Chart patterns in forex are a graphical representation of price movement consisting of highs and lows. Unlike candlestick patterns, they present themselves over several trading sessions, therefore longer. The patterns come into being as price oscillates up and down as traders react to various developments, including news releases.
Types of Chart Patterns in Forex
Forex trading patterns are broadly classified into two patterns: continuations and reversals.
Continuation patterns come into play after the price has moved significantly in a given direction. They come into play as traders lock in profits triggering some form of weakness. Despite the consolidation, the price often ends up breaking out and moving in the direction of the underlying trend. Therefore, continuation patterns assume that the price will remain in the same direction after consolidation.
The common forex chart patterns that affirm continuation in the long run include
Bullish Rectangle: It occurs at the top of the uptrend, characterized by prices moving up and down in a tight range that appears as a rectangle. Afterward, the price tends to break through the uppermost resistance level and continue moving up.
Falling wedge: Characterized by price moving up and down in a wedge-shape-like pattern after a significant upward move. As the wedge narrows price often ends up breaking out to the upside
Bearish rectangle: It occurs after the price has plunged significantly, resulting in a slight bounce back with the price oscillating up and down in a tight range. Finally, the price breaks out and edges lower after breaching the support level.
Bearish pennant: It is a forex trading pattern that occurs after the price has plunged significantly. The pennant forms with the price moving in a triangle-like shape that narrows. Afterwards, the price tanks and edges lower.
Reversal Patterns
Reversal patterns signify that prices will change direction and move in the opposite direction from the underlying trend. For instance, if the price was moving up once a reversal pattern occurs, it implies the price will end up edging lower.
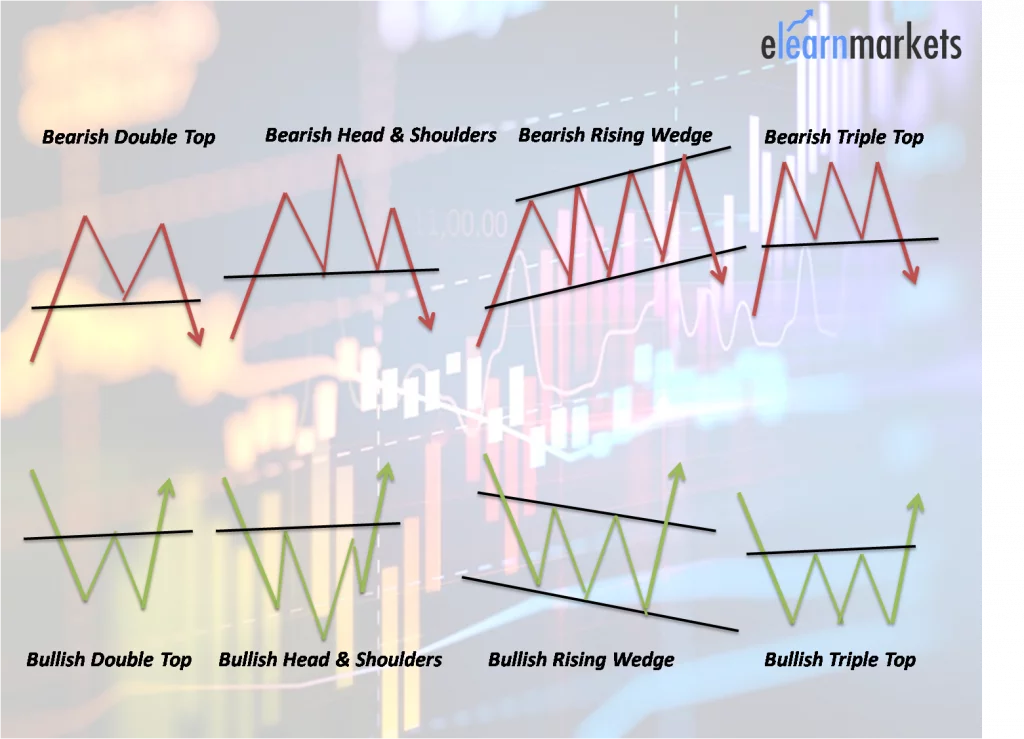
Double Top: A bearish reversal chart pattern that occurs in an uptrend. It appears when the price tries to move up but gets rejected twice at the resistance level. The result is price plunging after the second top.
Head and Shoulder: It is a chart pattern characterized by one high peak and two peaks on the side that are slightly below the middle peak. Once the pattern occurs in an uptrend, it signals price will end up reversing course and tanking
Double bottom: It’s the opposite of a double top and occurs after a significant move to the downside. The pattern is characterized by the price trying to move lower twice but getting rejected each time, resulting in a correction to the upside.
Inverse head and shoulder: They are forex trading patterns that occur at the base of the price chart after the price has significantly decreased. The pattern has two troughs of the same height and one large trough in the middle.
Difference Between Chart pattern and Candlestick patterns
Candlestick Pattern
• Formed by combining one or more candlesticks
• Occurs in a brief period as it includes one or two candlesticks
• Ideal for quick entry and exit into the market, perfect for scalpers
• Implies price direction over short period
Chart Pattern
• Formed as price oscillates up and down as a reflection of psychological and fundamental factors
• Mostly occurs on longer time frames
• Ideal for long term buying and selling signals
• Implies price direction over a long period