In the financial markets, prices oscillate up and down, resulting in unique price patterns. It is these patterns that traders rely on to understand the prevailing market condition and, at the same time, try to predict the future. Harmonics, or harmonic trading patterns are unique candlestick patterns in technical analysis that help traders understand price action and forecast where price might move.
What are Harmonic Patterns?
Harmonics are chart patterns that create geometric price patterns and help traders spot pricing trends. The patterns utilize Fibonacci numbers to define precise turning points. As a result, the patterns make it easy for traders to analyze and predict where and to what extent an asset price is likely to move.
The patterns are most powerful when traded once formed. The biggest mistake that most traders make is to try and assume that a pattern will form and attempt to trade it before it materializes. Given that harmonic patterns take time to form, they require patience. Nevertheless, in the long run, they provide greater insight into future price movements.
Harmonic patterns must meet certain movement requirements to be considered valid and thus be part of a trading decision. The conditions make trading more objective rather than subjective.
1. The ABCD Harmonic Pattern
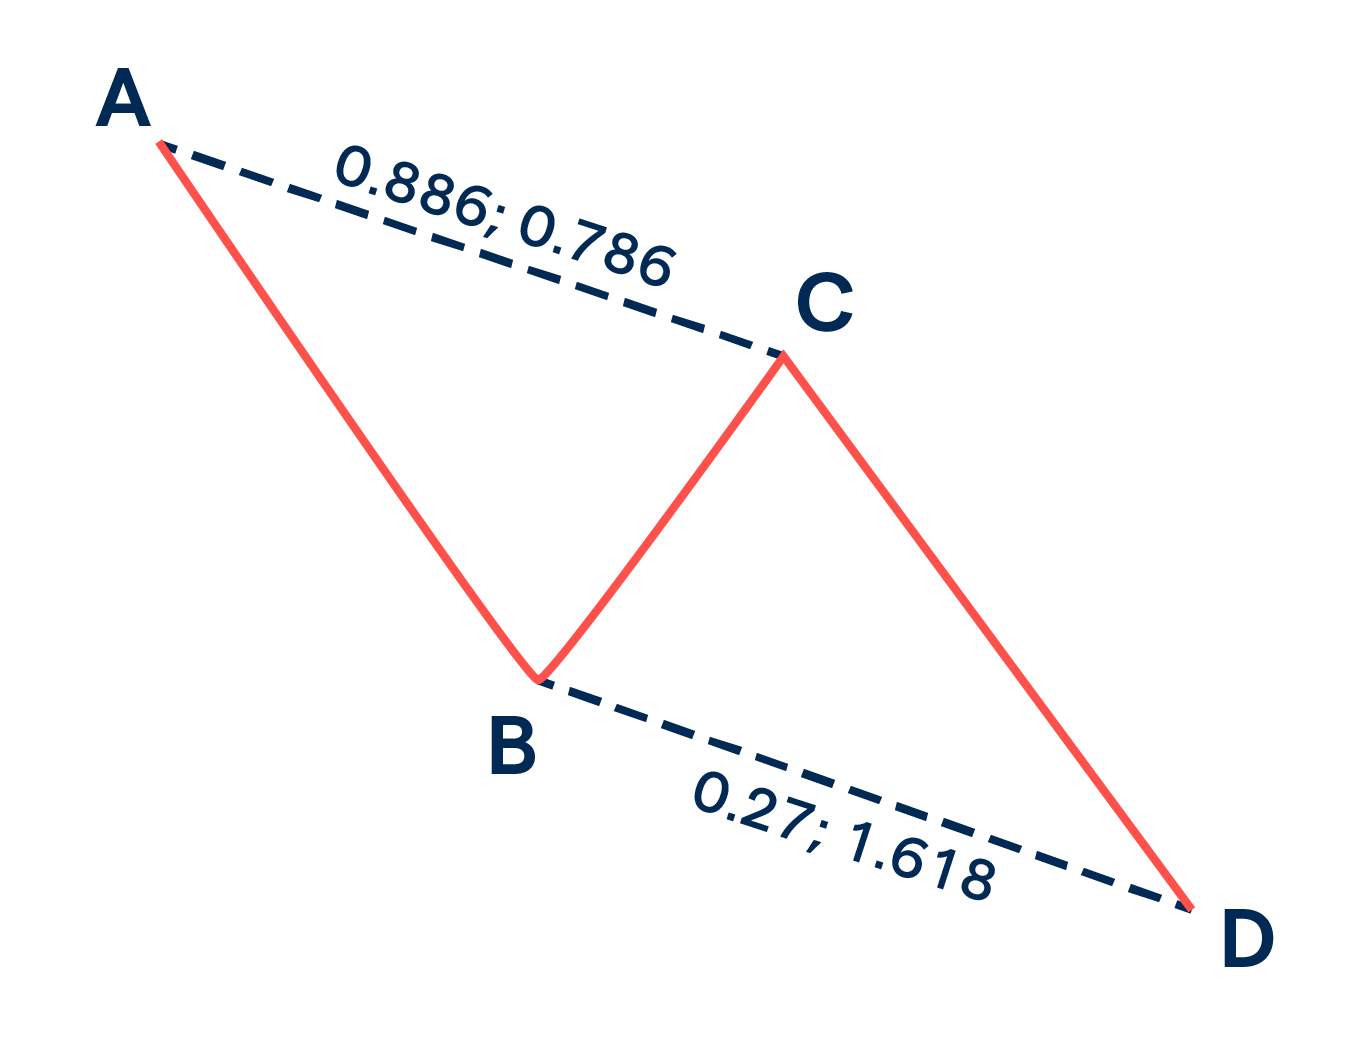
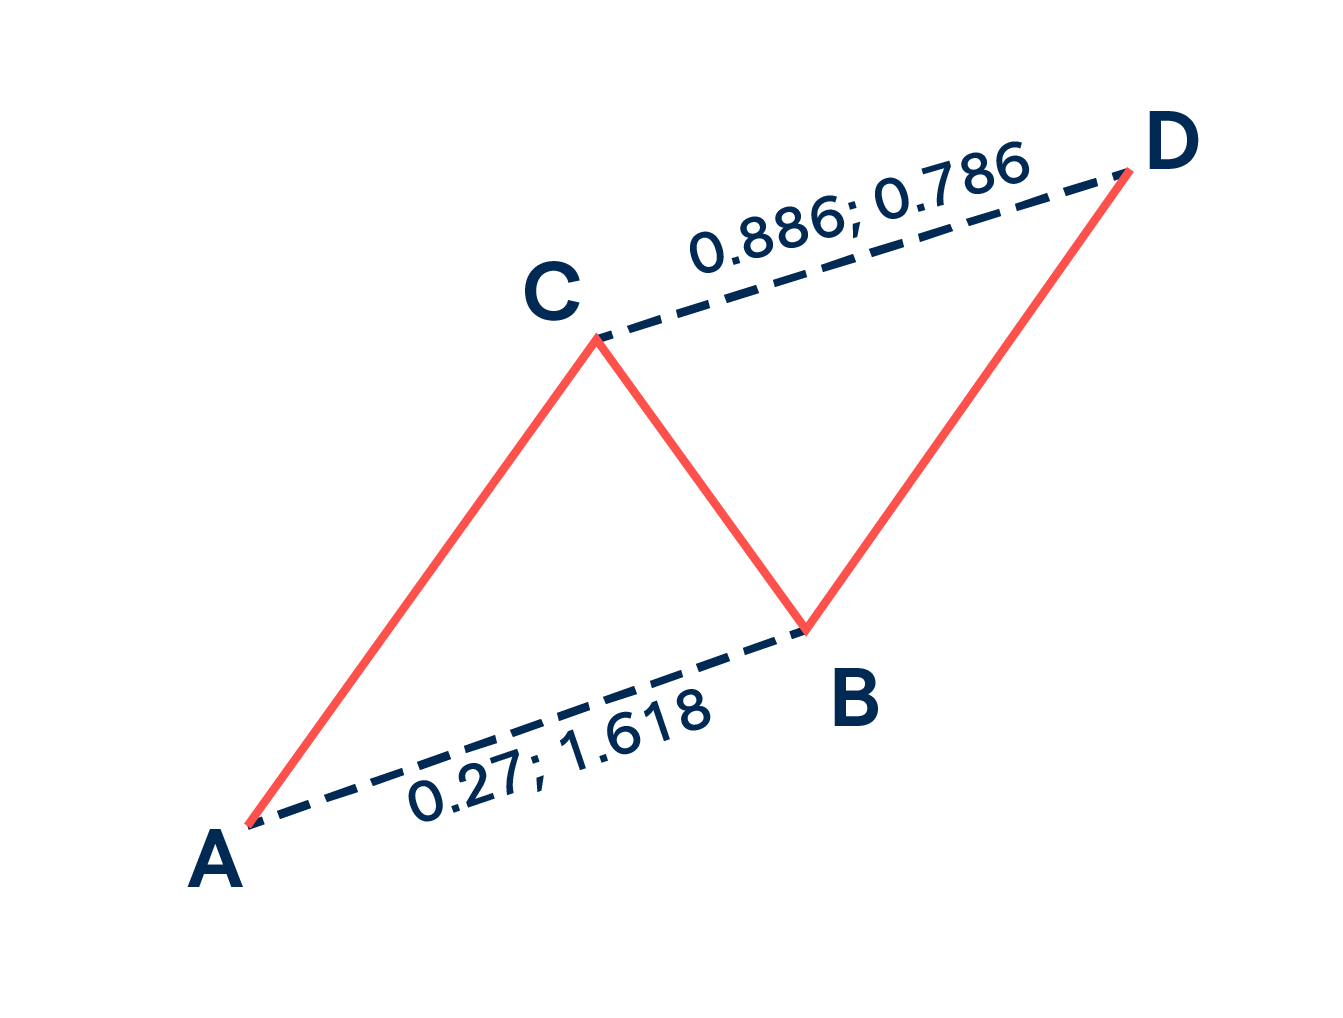
It is the most recognizable harmonic pattern composed of three movements and four points. The pattern can appear when the price is trending up or down. It consists of a first impulsive movement, either up or down, and a period of exhaustion kicks in, resulting in a corrective BC phase. The pattern is completed by a final impulsive movement (DC) in the direction of the first impulsive movement
Source: Ig.com
With the help of a Fibonacci retracement tool drawn on the AB leg, the BC leg should always reach the 0.618 level, which is the point where the corrective phase comes to an end. The CD line, on the other hand, is expected to be the same length as the AB line. Additionally, the CD pattern should take the same time to materialize as AB took
Source: Ig.com
In most cases, traders are advised to enter the market once the price corrects to the C zone, often referred to as the Potential Reversal Zone.
2. The Bat Harmonic Pattern
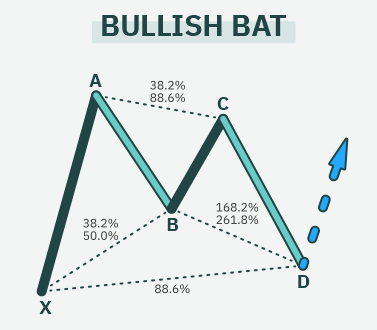
The Bat harmonic pattern gets its name as it manifests in the shape of a bat. The pattern has one more leg than the ABCD pattern and an extra point referred to as the X zone. The first leg, or the impulsive movement, is denoted XA, signaling strong price movement in a given direction, either up or down.
The strong movement XA is followed by a small correction AB, signaling weakness in the market. The correction should be 0.382 to 0.5 of XA on the Fibonacci retracement tool.
Source: Tokenist.com
Nevertheless, the price ends up retracing in the initial direction resulting in the BC leg. As a result, the BC leg should retrace 0.382 to 0.886 of the initial leg AB. BC’s failure to rise to the peak level of XA in case of a bullish market signals weakness. Consequently, leg CD is expected to edge lower and should be at 0.886 retracements of XA.
While trading the Bat harmonic pattern, bulls should look to open long positions once the price corrects to point D, referred to as the referral zone. The stop loss on all long positions should be placed a few pips below D or point X
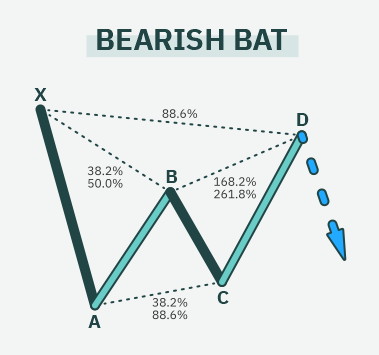
Likewise, the Bat harmonic pattern can happen in a bearish market, providing an opportunity to enter a long position. In this case, leg XA will signal the initial leg lower, implying short sellers are in control and trying to push the price lower.
Source: Tokenist.com
Nevertheless, price bouncing back forming leg AB implies a build-up in buying pressure amid waning selling pressure. The bounce back as part of leg AB should be 0.382 to 0.5% of leg XA on the Fibonacci retracement.
The Bat pattern is confirmed once short sellers come into the fold and try to push the price lower, forming leg BC, which should retrace 0.382 to 0.886 of leg AB. However, the seller’s failure to push the price past the previous low at level A signals waning downward pressure.
Once the price ounces off level C, it should retrace 0.886 of leg XA of 1.618 to 2.618 leg BC to point D to affirm the Bat harmonic pattern. Price failing to power above the previous high of level X signals the Bat pattern, implying traders should look to enter short positions.
3. The Gartley Harmonic Pattern
Developed by H. M. Gartley, it is a harmonic pattern that can be used to identify bullish and bearish trends in the market. With the help of the Fibonacci levels, one can know potential entry and exit levels in advance.
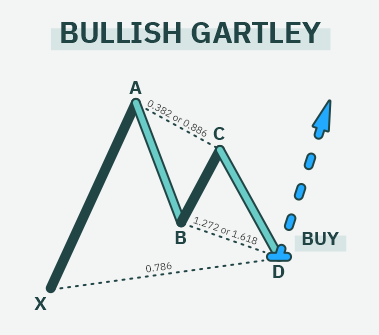
The bullish Gartley pattern appears when the price is in an uptrend, trading above key moving averages. Once pullbacks come into play after a significant move-up, they present an opportunity to buy low and ride the wave up to continue the long-term uptrend.
Source: Tokenist.com
The price is seen moving up in the bullish Gartley pattern above, forming the initial XA leg. Waning upward momentum attributed to traders taking profits results in price pulling back, consequently forming the AB leg. In this case, the correction AB should be 0.618 corrections of wave XA. Afterwards, bulls come into the fold and try to push the price up, resulting in leg BC which should be 0.382 to 0.886 retracement of AB
nevertheless, the upward momentum does not hold, resulting in price edging lower, forming leg CD, which should be 1.13 to 1.618 of AB. Point D should be 0.786 retracements of XA. Area D is considered a potential reversal zone whereby the price is expected to bounce back and move in continuation of the initial uptrend.
Traders should always await confirmation in the form of a bullish candlestick to enter a buy position at point D. A stop loss can be placed a few pips below the entry-level or a few pips below point X
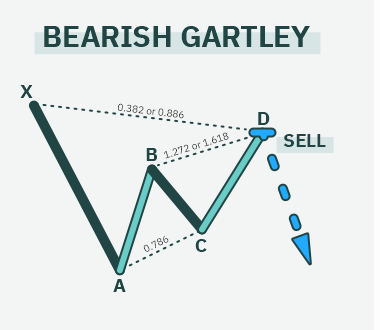
The bearish Gartley pattern occurs when the price is in a downtrend, resulting in the initial XA leg. Afterwards, exhaustion kicks in, resulting in the price bouncing back and leg AB, which should be a 0.618 correction of XA on the Fibonacci tool. The pullback that follows afterwards, resulting in leg BC, should be 0.382 to 0.886 retracement of lab AB.
Source: Tokenist.com
From Point, C price is expected to bounce back to Point D, which is a 1.13 to 1.618 correction of leg BC. Point D is considered a potential reversal zone from where the price is expected to reverse course and start moving lower. Traders can look to enter short positions from point D with a stop loss placed a few pips above point D.
4. The Butterfly Harmonic Pattern
The Butterfly pattern differs from the other harmonic pattern in that its point D tends to extend beyond point X in the bearish and bullish patterns.
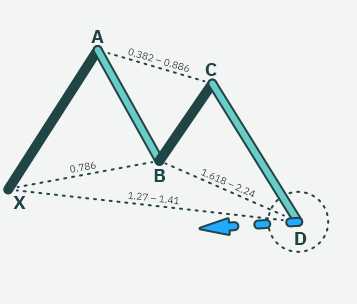
The Bullish Butterfly harmonic pattern starts with the price increasing, signaling the upward momentum resulting in Leg XA. Price later retraces from point A to point B. Leg AB should be 0.786 retracements of leg XA on the Fibonacci tool.
Source: Tokenist.com
Later, the price bounces off from point B to point C, which should be 0.382 to 0.886 retracement of leg AB. Price struggling to move up from point C results in leg CD, which should be 1.618 to 2.24 of extension AB. Additionally, point D should be at a 1.27 extension of wave XA.
At point D, traders should look to enter a long position from the Butterfly harmonic pattern. The formation of a signal candlestick, such as a bullish candlestick, implies buyers are flooding the market to try and buy from the new lows. The prospect of price edging higher from point D is usually high. In return, a stop loss for any long position should be placed a few pips below point D.
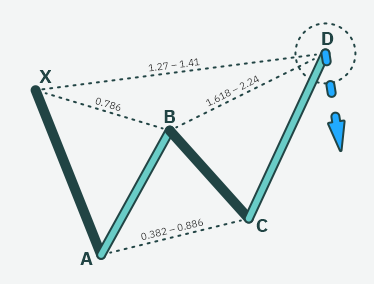
In the bearish Butterfly pattern, the price should be in a downtrend, trading below a key moving average. The formation of leg XA affirms short sellers are in control. Once exhaustion kicks in price could bounce back, resulting in leg AB which should be a 0.786 retracement of leg XA.
Source: Tokenist.com
From point B, sellers flocking the market could trigger leg BC, which should be a 0.382 to 0.886 retracement of leg AB. Later, the price bounces back, resulting in leg CD, which could be a 1.618 to 2.24 retracement of leg AB resulting in Point D. Additionally, point D should be a 1.27 extension of the wave XA on the Fibonacci tool.
Point D is the area to look to open a short position as the price is expected to edge lower on sellers flocking the market and trying to sell at the new highs. A stop loss can be placed a few pips above point D upon triggering a short position.
5. The Crab Harmonic Pattern
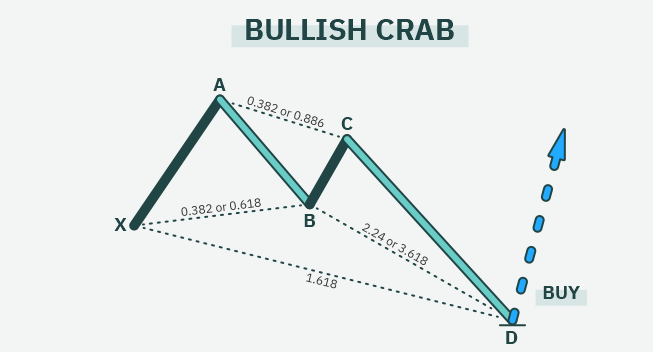
The Crab is a harmonic pattern for traders who want to profit from potential price reversals. In the Bullish Crab pattern, the price is initially in an uptrend resulting in leg XA. Afterwards, the price corrects, resulting in leg AB which should be 0.382 to 0.886 retracement of leg XA.
Price should bounce back, resulting in leg BC which would be a 0.382 to 0.886 correction of leg AB. Increased selling pressure would result in price tanking from point C resulting in leg CD that is a 1.618 extension of XA. Point D should be below point X. If the price is still in an uptrend above the moving average, a trader can look to enter a long position from point D as the prospect of price reversing from the downtrend is usually high.
Source: Tokenist.com
In the bearish Crab setup, the price must be in a downtrend, trading below a long-term moving average. The initial sell-off wave XA is immediately followed by a bounce back, forming leg AB that could form between 0.382 to 0.618 retracement of leg XA. Next, the price is expected to edge lower from the point, forming leg BC that should retrace 0.382 to 0.886 of AB. Later, the price should bounce back, forming a leg CD that is a 1.618 extension of leg XA or 2.618 8 to 3.618 retracement of leg BC.
With point D slightly above point X, traders can look to enter a short position as long as the price is still in a downtrend and trading below the key moving average. A stop loss on the short position can be placed a few pips above point D.
Bottom Line
Harmonic patterns present a precise and mathematical way of trading the forex market. They stand out partly because they can warn when underlying conditions are likely to result in a significant price drop or increase.
The idea is to be patient and practice identifying the patterns with their actual Fibonacci retracement levels. Any movement that does not align with the stipulated Fibonacci retracement levels should be discarded, as it can result in misinterpretation.
The long and short positions should only be triggered at the reversal zones when confirmation signals come into play. In this case, there should be a signal candlestick in the form of a bullish candle, implying the price is likely to increase or a bearish candlestick, implying the price is likely to move lower.