Technical analysis is one of the most important financial market trading aspects. The analysis sees traders leverage various indicators and study price patterns to try and understand price action to predict the direction price is likely to move. The Triangle chart pattern is a common pattern that generates unique trading opportunities.
What is a Triangle Chart Pattern
A triangle chart pattern develops as the price moves into tighter and tighter ranges signaling a decrease in volatility. It is formed by two converging trend lines as the price tries to move sideways. It is considered a consolidation pattern as it tends to develop after strong price movement in a given direction.
The pattern provides valuable insight into prevailing market conditions while also signaling future spike movement. In most cases, traders look for a subsequent breakout in the direction of the preceding trend.
Triangle patterns are broadly classified into three:
- Symmetrical Triangle
- Ascending Triangle
- Descending Triangle
Symmetrical Triangle
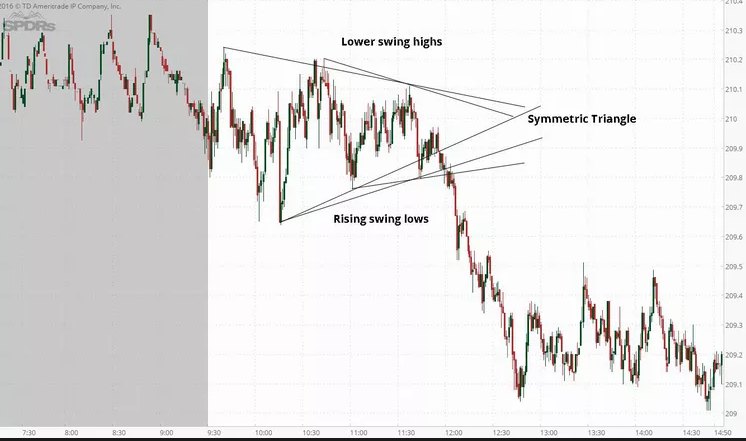
It is a triangle pattern characterized by asset prices confined in a smaller and smaller area over time. In this case, the price does not make any new highs or lows. Every bounce-back results in price forming lower highs and rising swing lows.
Source: Thebalance.com
Connecting the swing highs with a trendline and the swing lows with a trendline results in a symmetrical triangle that signals the price is moving sideways.
Ascending Triangle Pattern
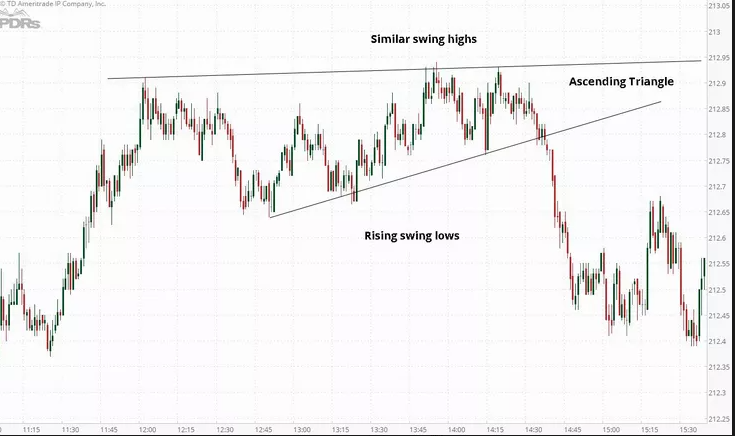
It is a chart pattern characterized by similar swing highs and rising swing lows. In this case, every time the price tries to edge lower, it closes at a slightly higher level than the previous low. Instead of edging higher and forming a new high, it gets rejected at the previous support level from where it edges lower.
Source: Thebalance.com
Therefore, the swing highs of the triangle pattern appear as a horizontal line, while an ascending trending line forms the rising swing lows.
Descending Triangle Pattern
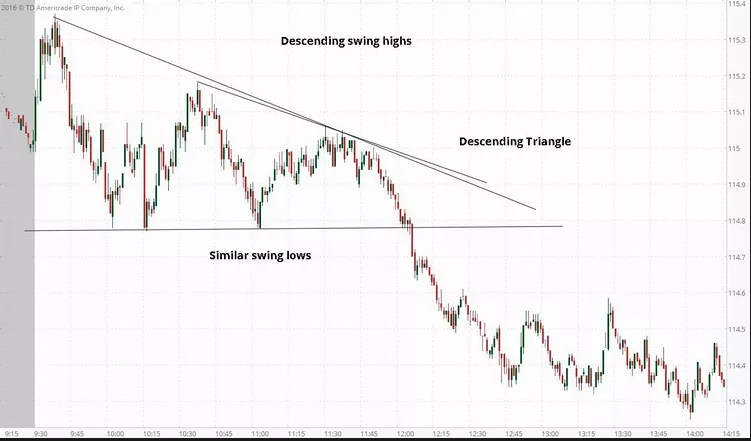
It is a triangle chart pattern characterized by a horizontal swing low and a descending trendline. Whenever the price tries to edge lower, it gets rejected at a key support level, bouncing back off the previous low.
Source: Thebalance.com
On the other hand, whenever the price tries to edge higher and form a new higher high, there is rejection at a slightly lower level than the previous high. The result is higher lows that result in a descending trending line.
Trading Triangle Chart Patterns
Breakout Strategy
It is the most popular strategy while looking to profit from triangle patterns. The strategy is based on the fact that price will eventually break out of the confined ranges in a triangle and move in either direction.
Therefore, this breakout strategy can be used in all the triangles as price action cannot be limited to asymmetrical, ascending, or descending triangles forever. Therefore, the execution of the breakout strategy is the same in all the triangles.
Breakouts occur when the price has moved inside the triangle for long, resulting in the thinning of the triangle. As the end becomes narrow and narrow, the prospect of price breaking out is usually high.
Source: Thebalance.com
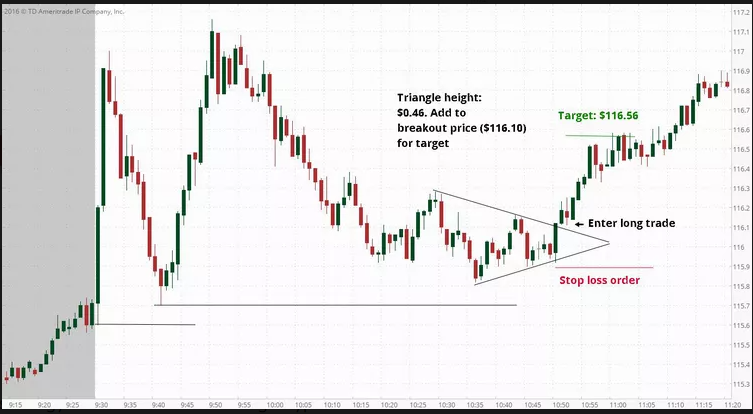
The idea is to buy or go long whenever the asset price breaks above the upper trend line on huge volume. The formation of a bullish candlestick above the trendline signals that bulls are in control and likely to push prices higher.
Traders open buy positions once the bullish candlestick closes above the upper trend line with a stop loss order placed a few pips below the previous low.
On the other hand, short or sell positions are triggered once the price breaks below the lower trendline. A breakout that occurs on high volume affirms short sellers in control and is likely to push prices lower. Once the price closes below the trendline, followed by a large bearish candlestick formation, traders trigger a sell position.
The objective of the triangle breakout strategy is to try and profit from price moving out of the triangle trendlines.
Continuation Triangle Strategy
Triangle patterns are consolidation patterns that occur after a strong price movement in a given direction. For instance, a descending triangle pattern may occur after a strong price movement to the downside. The triangle pattern may emerge as exhaustion kicks in and traders try to lock in profits.
In most cases, the price is often expected to continue moving in the direction of the underlying trend once the consolidation is over. Consequently, when a descending triangle pattern appears in a downtrend market, the likelihood of price breaking out to the downside is usually high.
Therefore, the continuation triangle strategy anticipates the price to always breakout below the lower trendline of the triangle.
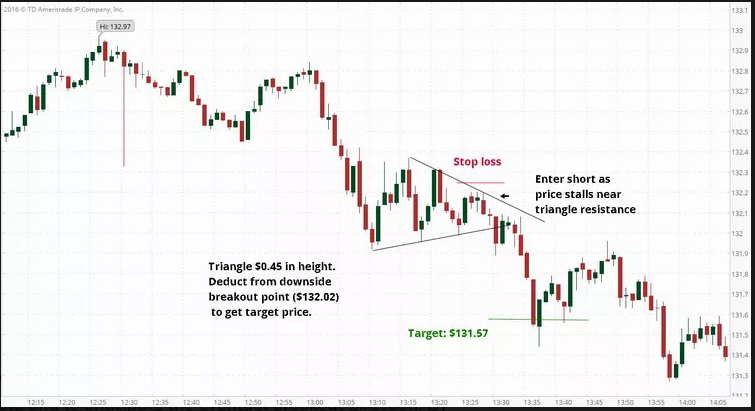
Source: Thebalance.com
The chart above clearly shows that the price was trending lower, followed by an asymmetrical triangle with the price forming lower highs and higher lows. Eventually, the price broke out to the downside and edged lower in continuation of the underlying downtrend.
While ascending triangle patterns occur in markets trending to the upside, price is often expected to eventually break out to the upside in continuation of the underlying uptrend.
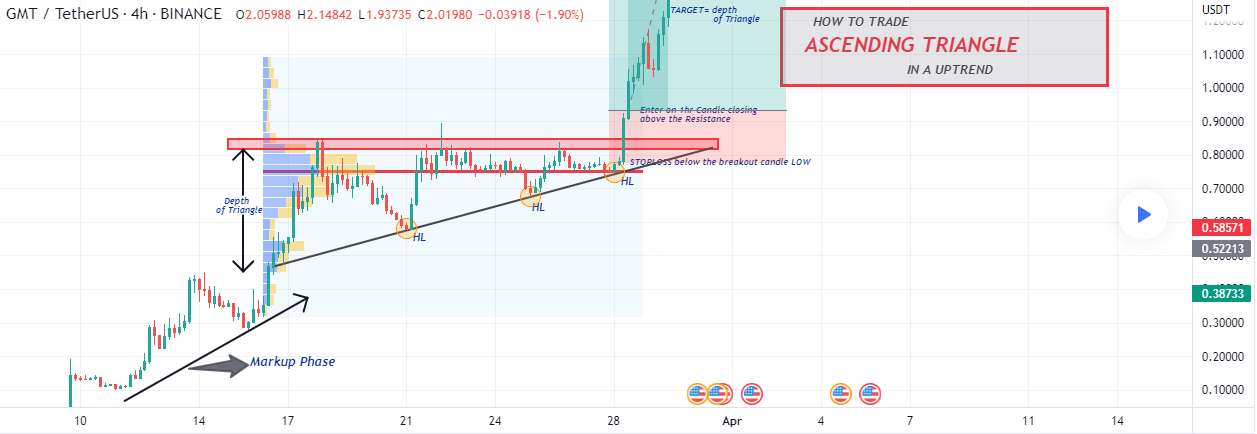
Source: Tradingview.com
The chart above clearly shows that the price was trending up, followed by an ascending triangle pattern as part of the consolidation phase. Eventually, the price broke out to the upside in continuation of the underlying uptrend.
Therefore, a trader who had anticipated price breaking out to the upside ended up placing a buy or long position on the formation of a bullish candlestick above the upper trend line. A stop loss can be placed a few pips below the triangle to reduce the risk on the trade.
With the continuation triangle strategy, the idea is to anticipate that the price will eventually break out of the triangle but in the direction of the underlying trend. For example, if the price is trending up, then the price will eventually break out to the upside above the trendline. On the other hand, if the price were trending lower, the price would break below the trendline.
False Breakouts
One of the biggest challenges while dealing with triangles is the occurrence of false breakouts. Such breakouts occur when the price moves out of the triangle only to reverse course and move in the opposite direction following the previous breakout. False breakouts often result in losing trades, but one can keep the losses low with adequate preparation.
Nevertheless, it is also possible to predict false breakouts and avert the risk of placing trades that might result in losses. For instance, if the asset price was trending up, it is highly expected to eventually breakout to the upside above the triangle.
If the first breakout occurs below the triangle at the lower trendline, it might be an early warning sign of a false breakout. Therefore, a trader can stay off the market to avoid the risk of losses.
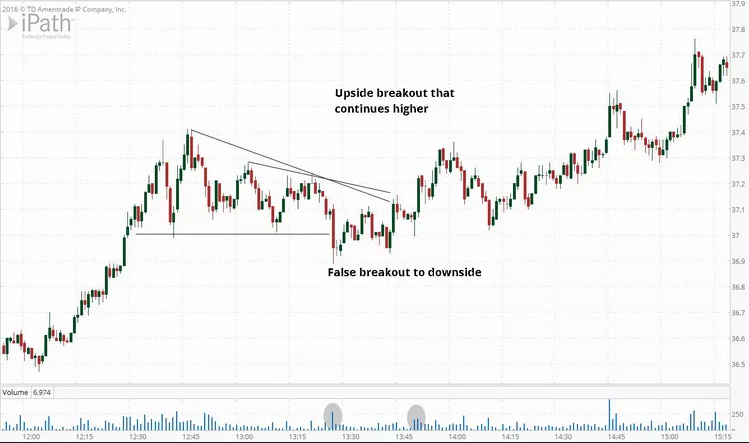
Source: Thebalance.com
The price chart above clearly shows that the price was trending up, followed by an ascending triangle. Eventually, the price broke out of the triangle to the downside. However, the false breakout eventually reversed course and started moving up in the continuation of the underlying uptrend.
Bottom Line
Triangles are some of the most effective patterns in technical analysis. Knowing how to interpret the triangle patterns is important for anyone looking to accrue significant pips once the price breaks out of the consolidation phase. In most cases, the price tends to break out of the triangle in the direction of the underlying trend, an important hint that helps traders know in advance the direction in which the market is likely to move.
Frequently Asked Question
A triangle trading pattern is drawn by connecting swing highs with a trend line and swing lows with another trend line. As the price moves in between, the two trend lines eventually converge, forming the triangle.
A triangle trading pattern is considered forming with at least five touches of the support and resistance levels. Consequently, there should be at least three touches on the support and two touches on the resistance or vice versa. Secondly, traders can anticipate a breakout to occur in the direction of the underlying trend.
A triangle pattern can be bullish or bearish, depending on the underlying trend. If the pattern occurs in a downtrend, it is considered bearish, and bullish if it occurs in a market trending up.
The triangle pattern has a 70% success rate.