Forex chart patterns are an integral part of technical analysis as they provide valuable insight into market sentiment, and the direction the price is likely to move based on what happened in the past. While there is no “best” chart pattern as all are used to highlight different trends, some stand out in their ability to provide reliable trading signals.
The trading patterns are broadly classified into bearish and bullish. However, some patterns stand out when trading volatile markets, while others work well in range-bound markets. Therefore, knowing which chart pattern to use to trade a particular market is essential.
Below are some of the most popular forex chart patterns.
Triangle Chart Patterns
Those patterns that serve as a mystery to traders are triangle chart patterns. Forex triangle patterns evoke dramatic suspense in currency market drama, indicating approaching breakouts as prices coil along converging trend lines.
The trading pattern occurs when prices converge with highs and lows, narrowing into a tighter price area. They are broadly classified into ascending and descending triangle patterns.
Ascending triangle pattern
Imagine climbing steps in a building, this is what an ascending triangle pattern looks on a chart. The ascending triangle pattern is a continuation of chart patterns in forex trading that occurs when currency pairs are trending up. It occurs when price action creates a horizontal resistance line and an ascending support line at the top of an uptrend. It also happens as weakness kicks in, following a solid move to the upside.
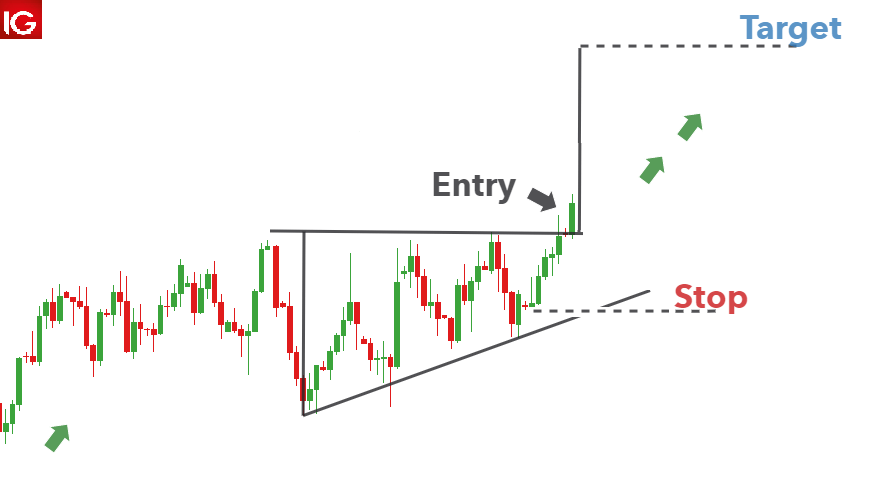
Source: Dailyfx.com
In most cases, the price breaks out of the ascending triangle pattern and moves up to continue the previous underlying trend.
Descending Triangle Pattern
Imagine sliding down a cliff, this is a falling triangle arrangement on a chart. The descending triangle pattern is also a continuation pattern that appears when the market is trending downwards. It is synonymous with a horizontal support line and a descending resistance level.
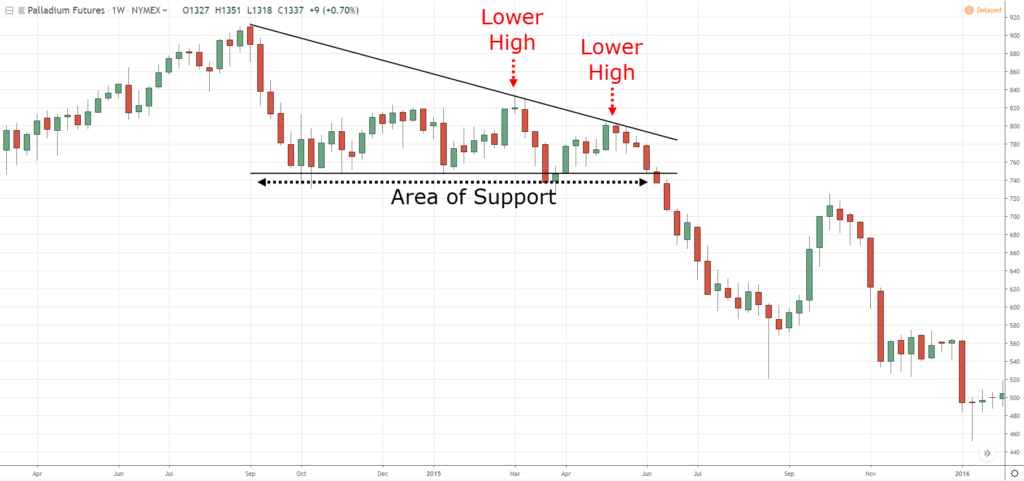
Source: Tradingwithrayner.com
Once prices become tighter and tighter within the triangle, they end up breaking out to the downside. Consequently, the occurrence of a descending triangle pattern signals the likelihood of price edging lower after some time in continuation of the underlying downtrend.
Engulfing Patterns
Engulfing patterns in trading resemble enormous waves rolling over smaller ones. They are common chart patterns in forex trading that are easy to spot and signal a potential change in the direction of the underlying trend. There are two types of engulfing patterns: Bullish Engulfing and Bearish.
Bullish Engulfing
A bullish engulfing pattern is comparable to a warm embrace from a friend following a difficult day. It occurs when the price appears to be moving lower. The pattern consists of one large bullish candlestick that engulfs the previous bearish candlestick. When the large bullish candle occurs when a currency pair is trending lower, it affirms a change in market sentiments from bearish to bullish.
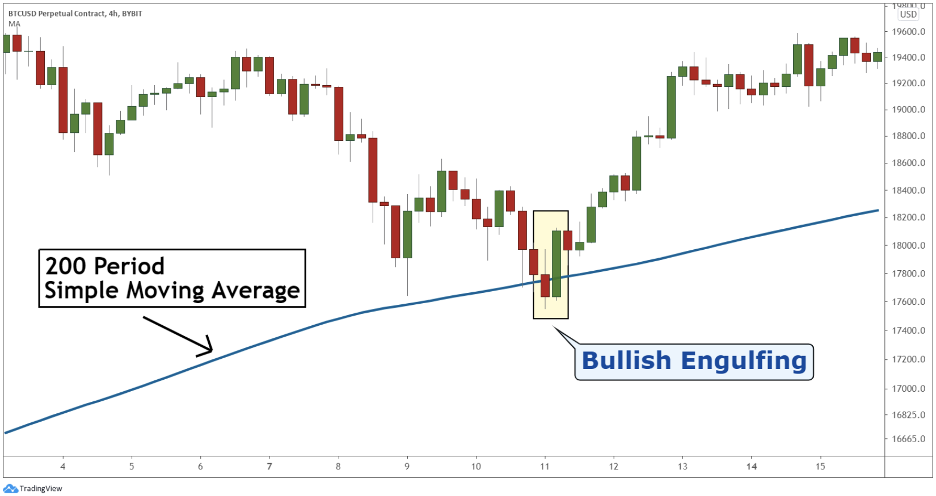
Source: Bybit.com
The bullish engulfing candlestick signals a buildup in buying pressure, implying prices are likely to continue moving up on reversing course from a downtrend.
Bearish Engulfing Pattern
Imagine an ominous cloud overpowering a sunny sky, this is a bearish engulfing pattern in trading. It typically occurs at the top of an uptrend. It is characterized by a large bearish candle that engulfs the previous bullish candlestick. The large bearish candlestick implies a change in market sentiments from bullish to bearish on bears overpowering bulls.
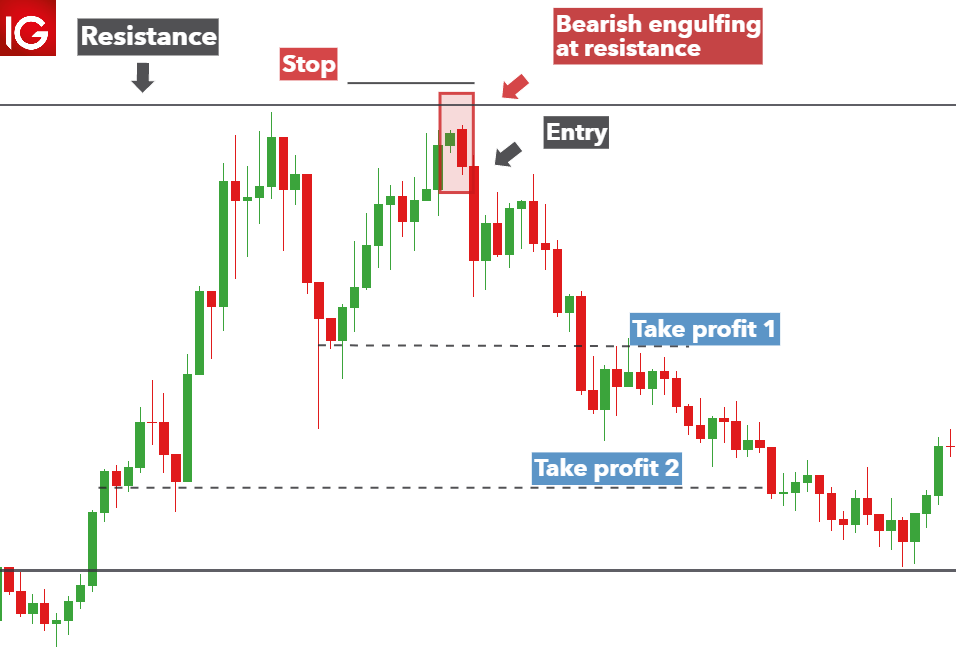
Source: Dailyfx.com
Consequently, the price often reverses course, from trending up to edging lower as bears enter the market and pile pressure on bulls.
Head and Shoulders Pattern
A statistically significant chart pattern referred to as the Head and Shoulders pattern signifies the price trend of an investment may be poised to reverse. It is composed of up of three distinct peaks: a higher peak that forms the “head” and “shoulders” shape, sandwiched between two smaller peaks. The head is the second and highest peak, the left shoulder is symbolized by the first peak, and the right shoulder is formed by the third peak.
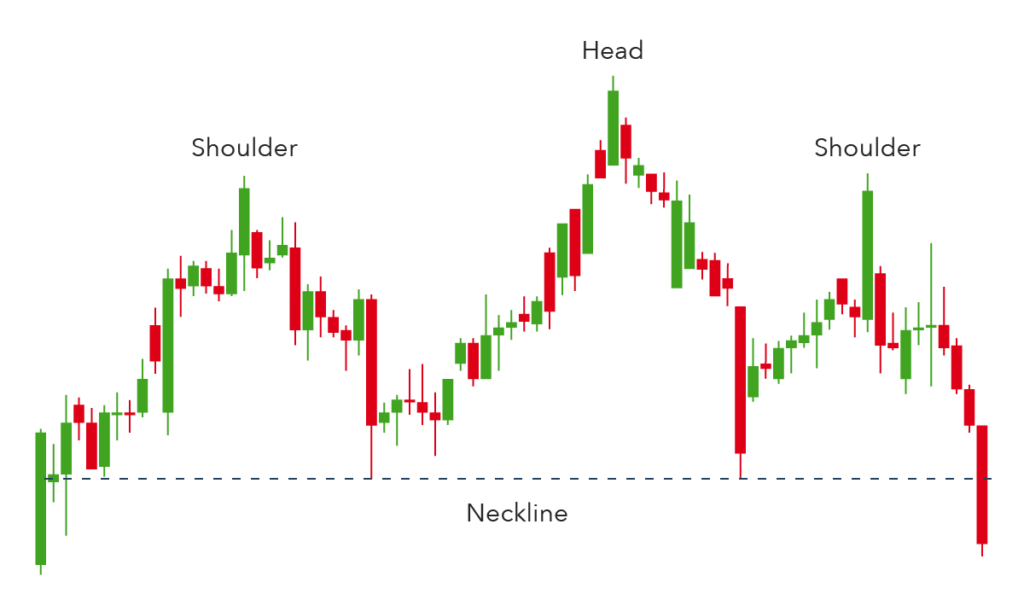
Source: IG.com
The pattern indicate a change in attitude from bullish to bearish, with the neckline standing as an important level of support. Before opening a short position, traders frequently wait for validation signals, such as a drop in volume and a clear breach below the neckline.
Double Top Chart Pattern
Another trend reversal pattern that occurs at the top of an uptrend is the Double Top. Imagine ascending a mountain and reaching the peak twice, this is the double top chart pattern. The pattern occurs when the price tries to break out of a resistance level only to experience a strong sell-off resulting in lower prices. However, buyers continue to enter the market at the neckline and try to push the price higher. Nevertheless, they experience strong opposition at the top resistance level, resulting in the price edging lower.
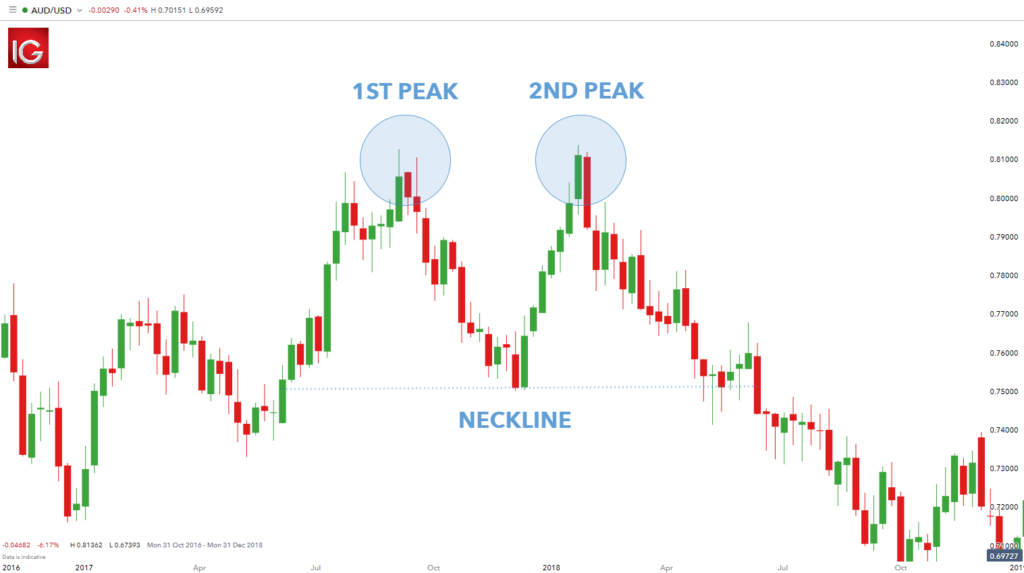
Source: Dailyfx.com
The fact that the price tried and failed to move higher on two tries results in two tops, thus the double top pattern. Technical analysts enter short trades as price breaks below the neckline or support level after the double-top chart pattern.
Double Bottom Chart Pattern
Imagine drilling a hole and hitting solid ground repeatedly, that is the double bottom chart pattern. The reverse of the double-top trading patterns occurs at the base of a price chart. The chart patterns in forex signify waning short-selling pressure. Sellers try to push prices lower but fail, resulting in two lower bottoms.
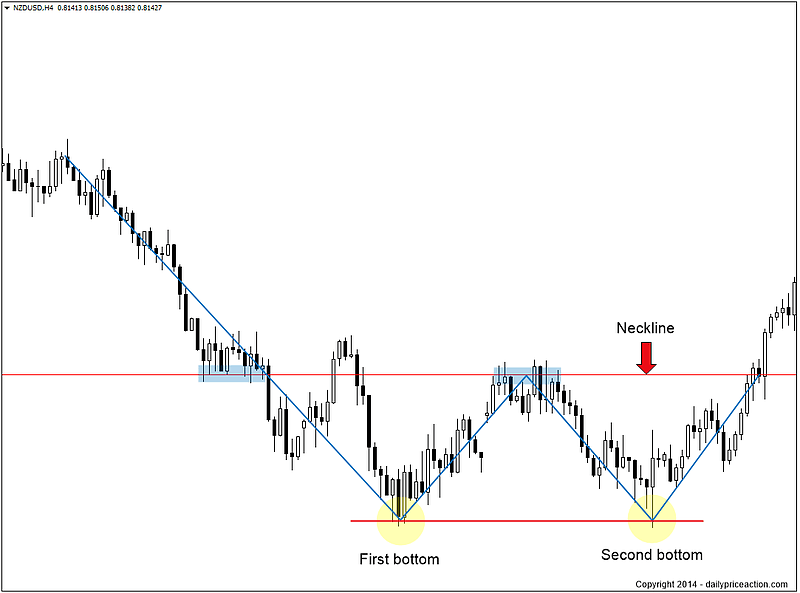
Source: Dailypriceaction.com
Price moving up after the double bottom formation and breaking out of the resistance level or neckline affirms a change in market sentiments from bearish to bullish. Consequently, the price often breaks out to the upside, providing ideal opportunities to enter buy positions.
Cup and Handle Pattern
A cup and handle pattern is a bullish continuation pattern that indicates a period of bearish market sentiment before the market turns bullish. Consider drinking from a cup with a handle, this is the cup and handle pattern in trading. At first, prices tend to move lower before hitting a support level, resulting in a round-shaped bottom. The round-shaped bottom affirms waning short-selling pressure as bears struggle to push prices lower.
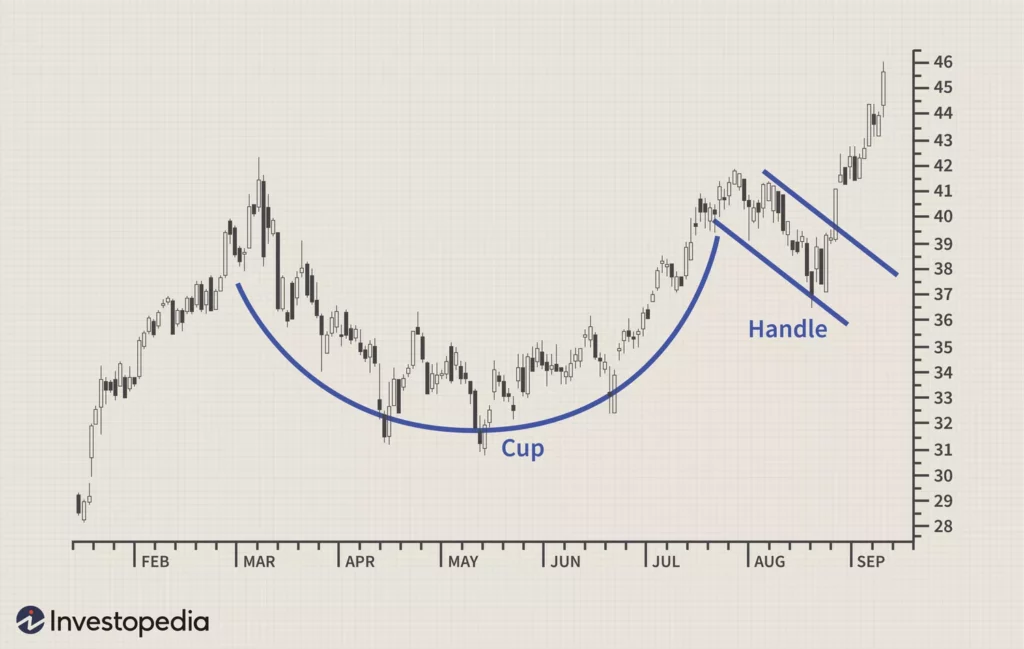
Source: Invetsopedia.com
The cup appears as the price bottoms out of the round bottom and moves up. However, instead of price edging higher after bottoming out, there is usually short-term retracement whereby the price moves lower before breaking out to the upside resulting in the handle-like pattern.
Once the price reverses course from the handle, it allows buyers to open a buy position as it affirms the price is likely to make higher highs.
Benefits and Limitations of Chart Patterns
Chart patterns provide various advantages to forex traders. For starters, they offer graphical illustrations of market actions, enabling traders to better spot trends, assistance, and resistance levels. The graphical accuracy allows traders to understand the state of the market and make more informed currency purchases or sales. Forex trading patterns resemble recognizable melodies in the currency market symphony, providing traders with predictable indicators for expected price changes.
Secondly, patterns in charts may help traders predict future price moves. Traders can foresee probable market breakouts or collapses by spotting patterns like triangles, head and shoulders, and double tops and bottoms. Different forex chart patterns are like an assortment of characters in a currency market drama, each with its own unique traits and inclinations.
Furthermore, forex pattern recognition is similar to mastering a new language: traders teach their senses to recognize recognizable shapes and configurations on price charts. With skill and observation, traders might acquire a sharp eye for seeing patterns and comprehending their consequences.
However, making choices based only on chart patterns has restrictions. One key restriction is that chart patterns depend on historical price data, which means they may not always repeat exactly. Market conditions might fluctuate swiftly, resulting in misleading signals or unanticipated price moves that discredit the pattern.
Additionally, chart patterns neglect to account for basic variables that can influence the value of currencies, such as economic statistics, geopolitical developments, or central bank policy. Reversal chart patterns are like story telling twists in the currency market conflict, but indicating possible changes in direction after long-term trends.
As a result, while chart patterns can be beneficial instruments for forex traders, they must be used with other technical and fundamental research approaches to make well-informed trading decisions.
How to Start Using Forex Chart Patterns
Before you start adding forex charts patterns into your approach to trading, first become comfortable with the most frequent patterns and the characteristics they possess. Use literature, online tutorials, and instructional websites to gain knowledge about patterns like triangles, head and shoulders, and double tops and bottoms.
Following that, practice detecting these patterns using previous price charts and simulated trading platforms. Watch for patterns with distinct shapes and well-defined degrees of support and resistance.
As you develop expertise, create a set of criteria for determining the truthfulness of a pattern prior to choosing a trading preference. This could encompass waiting for a breakout or breakdown outside the pattern’s limits. Forex graph patterns are similar to planets in the night sky, helping traders across the great span of market changes with distinct shapes and formations. Horizontal support and resistance levels are analogous to solid floors and ceilings in the currency marketplace, where prices tend to surge or stop temporarily.
Finally, keep a patient and disciplined attitude to forex trading chart patterns. Not every pattern will lead to a good trade, so be willing to accept losses and learn from your mistakes. Review and adjust your trading strategy on a regular basis, taking into account your experience and market conditions.
By adhering to these rules and conducting thorough study, you may efficiently integrate the best forex chart patterns within your trading strategy and make wise currency market selections. The most common forex patterns resemble known monuments in the currency market environment, giving traders recognizable indicators for possible price changes.
Bottom Line
The six most common forex charts patterns are essentially blueprints for traders navigating the foreign currency markets. From triangles to engulfing patterns, they offer essential insights into prospective price shifts, facilitating enhanced decision-making and strategy building.